Sunday, February 27, 2011

Taking A Cue From The Crude

The market is taking its cue from the crude oil. When the WTI crude sold off after it has climbed above $103 a barrel, the dip buyers came in and halted the market decline.

SP500:


DJIA:


The Nasdaq 100 actually started its bounce a day earlier. Both days when it dipped below the 50 SMA, it bounces back above it.

Nasdaq 100:


These bounces off the 50 SMA formed an intraday double bottom pattern for the Nasdaq 100 with the low around 2284. This intraday double bottom pattern has a measured move target level around 2352. There is also a resistance level near 2366.

Nasdaq 100 Intraday:


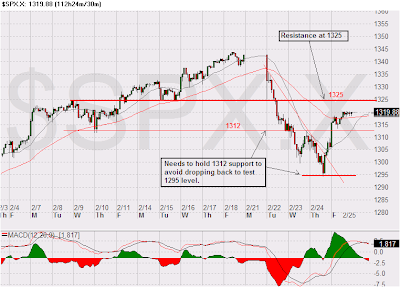
The intraday chart for the SP500 shows the 1312 level appears to be a resistance turned support level. If the SP500 can hold above the 1312, then the next level of resistance is 1325.

SP500 Intraday:


The DJIA bounced off the 12,000 level and it is testing the 12,150 resistance. If it can get through the 12,150, next likely resistance level will be 12,200.

DJIA Intraday:


The market appears to have found some short term supports, but the uncertainties in Libya will keep the market on edge.


Share It

Tuesday, February 22, 2011

Deja Vu

Could this be deja vu for the market? Will today’s selloff turn out to be like the one on January 28, 2011, a one day pull back event. Or this time the market will have a correction and the SP500 will pull back to the 1275-1280 region before it resumes its ascend to higher high.

The following chart shows the support levels to monitor for the SP500.


Share It

Saturday, February 19, 2011

Target: 1350

Not much to be said about the market as it continues to grind higher. The only thing that has changed recently is more and more traders are talking about SP500 1350. As of Friday’s close, the SP500 is only 7 points from 1350. This target will likely be reached when trading resume next Tuesday for the US market. I am still watching for any sign for the widely anticipated correction to occur. Until then, I will continue to be cautiously bullish.

SP500:


Share It

Monday, February 14, 2011

MGM - (Exit 2/14/2011)

Closed out the MGM trade today. Click this MGM 2/7/2011 link to read the complete post along with the updates for this trade.


Share It

Sunday, February 13, 2011

Still Trending Higher

After a very brief pull back, the market continue to trend higher. The SP500, DJI, and the Nasdaq are bumping up against their trend line as resistance. If they breakout, the SP500 next resistance will likely be near the bull flag measured move of 1350, and the DJI near the 12,450, while the Nasdaq 100 could move toward 2450-2500 level. The lagging DJT finally caught up and getting ready to breakout, and the Russell 2000 is forging ahead once again after lagging for a while.

This coming week is another OpEx week, and the volatility it brings could be the catalyst for the market to surge to the next resistance level or to pull back to support levels. I am still cautiously bullish and continue to trade with reduced size.

SP500:


Nasdaq 100:


DJI:


DJT:


Russell 2000:


Share It

Wednesday, February 9, 2011

MGM - 2/7/2011

2/14/2011 update:

I almost gave back the gains from my MGM trade. I normally do not trade through earnings, and knowing MGM is scheduled to report its earnings on 2/14/2011, I was prepare to close out the trade before it reports. The mistake I made was I did not realize MGM is schedule to report before the market open on 2/14/2011. When I found out this weekend that MGM will be reporting before the open, the only thing I can do is to close out my position in pre-market. The price that I closed out the position is simply catching a bid to get out before MGM reports. Fortunately, I caught a bid near the 15.70’s and got out with an average price of 15.71. Although this trade did not hit the 16.90 price target, but it did realized a gain of 1.07R.

Here is the 5 minutes chart of MGM showing some pre-market price actions:


and the daily price chart for the day this trade ended:


2/7/2011:

This is my recent swing long trade based on a bounce off support for a casino stock, MGM.

I entered a long position on 2/7/2011 when the price move above the previous session high of 15.04 after an intraday low was made near the 50 SMA. The target level for this trade is 16.90. The day after this trade was entered, MGM gapped up on the open after an upgrade from Bank of America/ML. I took a partial profit when it moved above +1R and set the stop near my entry level for a risk free trade for the remaining size. The initial stop loss for this trade was set at 14.40, a price level slightly below the 50 SMA.

The MGM weekly price chart shows there is a long term resistance at 16.90 and it has retreated from this resistance level three times within the last 2+ years.


A swing long trade was entered on 2/7/2011 based on the bounce off the 50 SMA and the supporting trend line from the daily price chart.


The 15 minutes intraday chart pointing out where the trade was entered after the price break above the 15.04 level.


I will provide an update after I have closed out the remaining size.


Share It

Tuesday, February 8, 2011

Where To?

The market continue to move higher and putting lot of traders on edge, myself included. Many traders are probably asking the question "Where to?" One possible answer for the SP500 is 1352, the measured move of the bull flag.

Although I am leaning toward the sideline, I will not be shorting the market at this juncture. The upside momentum is simply too strong when the market decides to move higher.

SP500:


Share It

Monday, February 7, 2011

Murky Picture

The lagging market indices from last week have caught up with the DJIA and they all move to new recovery high today. The only remaining lagging market index is the Dow Jones Transportation (DJT). The DJT continue to trail all the market indices.

On the surface, the market still appears it wants to go higher. Underneath it, there are signs that this uptrend could be ending. One sign is the recent market leaders are showing some exhaustion price action. The semiconductor sector ETF, SMH made an intraday reversal today. The energy sector ETF, XLE wicked up and ended with an inverted hammer (shooting star) candle. The SP500 ETF, SPY also is beginning to show sign of fatigue. The QQQQ and the XLK ended the day with long wicked inverted hammer. If the market was not in an extended state, these inverted hammers or shooting stars will not be a concern. But this market has been rising without a pause or a correction, these price actions could be a sign that most of the longs are in the market and a reversal could occur shortly.

Here are the charts. The trend still look good, but the price action is a bit disturbing. The market is presenting a murky picture. Until the picture is cleared up, I am taking a step toward the sideline. I would rather err on the side of missing a big up move than being trapped in a sharp reversal.

SP500:


DJIA:


DJT:


Nasdaq 100:


QQQQ:


SPY:


XLK (Tech ETF):


SMH (Semiconductor ETF):


XLE (Energy ETF):


Share It

Wednesday, February 2, 2011

Get Ready

The DJIA closed above 12,000 and the SP500 closed above 1300 after a brief and quick pull back from last Friday, 1/28/2011. While these two indices decisively closed above their milestone level, things are not as rosy as they seem on the surface.

Today the DJIA continue to move to a new high by closing at 12,042, 1.8 points above previous session’s close. But the other market indices failed to follow the DJIA to close at a new high. The SP500 closed down 3.56 at 1304.03, the Nasdaq closed down 3.86 at 2321.09, the DJ Transportation is nearly 200 points below its previous peak, and the Russell 2000 is little more than 10 points below its previous high. In addition, the number of declining stocks is more than the advancing stocks. These divergences are a sign of a weakening market. Unless these divergences resolve themselves in the coming trading sessions, I will get ready to move to the sideline.

DJIA:


SP500:


Nasdaq 100:


DJT:


Russell 2000:


NYSE Advance/Decline:


Share It