Tuesday, March 31, 2009

Who Screamed Fire

The DJI gave up some 400 points or 5% in the last two trading sessions after it has gained more than 1377 points, or 21% from the March 9 close of 6547.05. The SP500 gave up 45 points, or 5.4% from last Thursday's close. Similar to the DJI, the SP500 gained more than 156 points or 23% from the March 9 closing level. For the Nasdaq 100, it also has gained more than 237 points, or nearly 23% from the March 9 close. The Nasdaq also gave up 60 points, or 5% in the last two trading sessions.

This bear market rally was one of the most anticipated rally in the recent past and before last Thursday, there was a high level of anticipation for the inevitable pullback after this tremendous rally since March 9 new closing low. When the pullback finally arrive on Friday and continued onto today's trading, the pullback was quick and sizeable. Take a look at last Friday's market action, 133 of the 143 points loss for the trading session were incurred at the opening minutes. Likewise in today's trading, more than 222 points of the nearly 250 points loss were incurred in the first few minutes of trading. These kind of pullbacks remind me of an analogy of someone in a packed theater yelled "Fire". When the dreaded scream of "Fire!" was heard, everyone in the theater quickly got up from their seat and exited at their nearest exit. Just like the market, someone screamed "Fire!" and everyone exited. Now the question is "Who screamed fire?" Someone that actually saw a fire burning or the local fire marshal decided to conduct a fire drill.

Is this pullback signal the end of the bear market rally or is it simply a consolidation before the rally resume? Lets take a look at the SP500. In the first chart, I have drawn the price channel this rally has been climbing in. As one can see, the angle of ascend for this price channel is too steep to sustain. If this is the channel that define this rally, then today's price break is a breakdown of the price channel and a new down trend will be established.


The next chart is a less steep price channel using 780 as the support level for this pullback.


And finally,


using the November low at 740-750 as support level, this price channel is the widest of the three. How this pullback will play out is depended on which price channel define this bear market rally. If the most narrow and steepest price channel define this rally, then when the SP500 fail the support level at 750, it will signal that the DJI is heading down to a new market low. But if either one of the other two price channel define this rally, then look for further upside from this bear market rally before it ends.

Similar scenarios for the DJI and the Nasdaq 100.


So who screamed fire? Is there a fire or is this a fire drill. The market will tell us as it retrace to various support levels whether this pullback is a consolidation or a new down trend. Pay attention to the support levels for direction.


Share It

Friday, March 27, 2009

When Will This End

This relief bear market rally has been very frustrating to the bears and agonizing to those sitting on the sideline. When this rally started, most market participants were looking for the DJI to rally back to 7100 and at most back to the Nov 2008 low in the 7500 range. Instead, the DJI has surpassed the 7500 level and it is now approaching 8000. Every time the bears call for a pullback, the market continue to move higher to squeeze the shorts and antagonize the non-believers. As this rally continue, more and more talking heads are starting to think this rally might be more than a bear market rally and questioning when this rally will end. It is precisely this change in sentiments will bring this rally to an end.

Here are the latest charts with updated commentary:


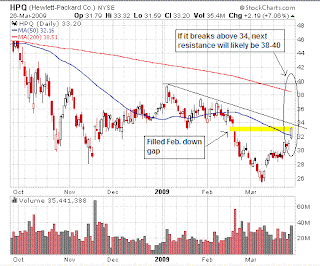
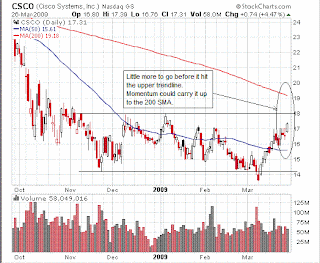
I believe this rally won't come to an end until the DJI breaks the 8000 level and move toward the trendline resistance level around 8300-8400, and the SP500 tested the 870 level with the Nasdaq 100 moving up to the 1400 level. Some of the movers that will help propel the market to these levels will be the tech heavy weights such as HPQ, AAPL, INTC, CSCO and AMAT.


I'll be watching closely for the end of this rally and start locking in on some of the profits from the longs. when this rally has ended, the next downward move for the DJI could be the bottom everyone was looking for.


Share It

Tuesday, March 24, 2009

Is The Gold Trade Over?

After a big reversal last Wednesday, gold has been consolidating. Some would say it has been selling off. But in regardless how one characterize it, the reality is the price of gold has been pulling back from the 970 to the 920 level. From the charts, one can see a setup is developing for a trade in gold. For those that have no particular directional opinion on which way gold will move, then a possible trade would be a straddle or a strangle option on the gold ETF, GLD to capture the next up or down move. For the bears, when the price move below the supporting trendline, go short on GLD with a very tight stop on the other side of the supporting trendline. Finally, for the bulls, the reverse position of the bears can be taken by going long on GLD with a tight stop below the supporting trendline.

I believe gold is at a nice spot to start a trade with minimal risk if you respect your stop. Take a look at the charts. The reason gold is at a good spot to start a trade is you will find out whether you are on the right side or the wrong side of the trade very quickly. And if you are on the wrong side and got stopped out, reverse your position and still end up playing the next move. No matter how you trade it, respect your stops to stay in the game. Is the trade on gold over? To me, it just got started.


Share It

Monday, March 23, 2009

Here We Go

Today's toxic assets plan announced from the US Treasury got the market flying. NYSE up/down volume ratio was 40 to 1, and the advance/decline was 10 to 1. In the Nasdaq the up/down volume was almost 16 to 1 with the advance/decline 5 to 1. The DJI closed at 7775.86 with a gain of 497.48, while the Nasdaq 100 closed at 1259.81, a gain of 72.63 and the SP500 closed at 822.92, up 54.38 points. This rally will lure more of the sidelined money into the market, and this will provide the fuel for further upside. So far, the market appears to be playing out one of the scenario I have put forth in my last Friday post.

Here are the updated charts:


Although the market have more room to climb higher, but be mindful it is still in a bear market. I'm selectively long and will switch out quickly if this rally comes to an end. One should never be over extended with longs in a bear market rally, as it can terminate and reverse abruptly. So be selective.


Share It

Saturday, March 21, 2009

Another Golden Look

Here is a chart on GLD showing the inverted H&S pattern, the gapped up breakout of the inverted H&S, and the uptrend price channel. Notice the rising 50 & 200 SMA, and the 50 SMA is above the 200 SMA along with the price being above both SMA. All these factors are bullish for gold/GLD in the near term.


Share It

Friday, March 20, 2009

Now What?

With the quadruple witching over, now what?

The market sold off today during options expiration, but it is still holding most of the gains made from the recent up move. Looking at the technicals and the sentiments, I believe there is still more upside to come. The market might pullback to test for support before making its next move up. This test will give us a confirmation on the validity of the next move.

The chart below shows the DJI pulled back from the Nov 2008 low and it could end up at the nearest support level around 7100. If it fails to hold this support, then this relief rally is over and the DJI will be headed down for a new low. If it hold support at 7100, it can move back up to the 7500 level and possibly break above it. This next rally could be the one that will move some of the money on the sideline back into the market. Currently, there are too many people with the mindset that this is a bear market rally. Although we all know that is true. But the market will defy the herd mentally. It will continue to move up to force those non-believers into believing this rally is more than a bear market rally. In order to do this, the DJI will need to move above the 8000 to lure some of those sideline money in. My current scenario is, DJI need to hold 7100, then test 7500 and move toward 8000-8300. Of course, the market will be the ultimate decider on what it will do.


For the SP500, it pulled back from a confluence of resistance. It encountered resistance from two trendlines and the 50 SMA. It needs to hold support at the 750 level in order for the rally to continue. If the rally continue and it breaks above 800, it can potentially hit 870 before this rally come to an end. It is this possible scenario that I am holding off on shorting the market until I see more evidence that this bear market rally is coming to an end.


The Nasdaq 100 is still inside the trading range, and I expect it to continue to bounce around in there until it breaks the 1130 support.


Oil broke above $50 a barrel and heading higher. $55 a barrel is very likely in the near term.


Mid 30s for the ETF, USO is possible.


Gold took a breather today at a relatively low volume comparing to the two previous trading session. I believe it could hit $1000 an ounce and the ETF, GLD will go above 98.


My position on the market is to wait for it to pullback to support level. If the market hold support, then re-initiate longs otherwise renew shorts as the market is still in a bear market. I am continuing to monitor for trading opportunities in gold and oil via their ETF, GLD & USO respectively. These two commodities are now a play on the weak dollars and future inflation. Deflation at the moment is off the table with the latest Fed decision to buy long term treasuries.


Share It

Wednesday, March 18, 2009

Are You Still Skeptical About This Rally?

This is a bear market rally and it will terminate when it reaches its objectives. The objectives are to squeeze all those skeptical bears and trap those anxious bulls. With options expiration occurring this week, a high level of skepticism on the strength of this relief rally, and the latest announcement from the Fed on buying $300B worth of long term treasuries, the market continue to chop higher. As those skeptics sitting on the sideline feeling they might be missing the rally finally dive in and those stubborn bears getting squeeze on their shorts as the market continue to move higher, the rally will then come to an end. From the following charts, I have reiterated the levels I been monitoring. I believe this rally is getting close to the end. Therefore, I will be starting to trim my long equity positions and use tight stops. I will continue to focus on trading opportunities for the gold and oil ETF, GLD & USO respectively.


The Gold Trade

As gold retraced below the trendline and went under $900 an ounce today, a dramatic reversal occurred soon after the Fed announced its intention to buy $300B of treasuries. Gold recovered all its earlier losses and ended up nearly $40 an ounce, a $60 plus intraday reversal. The manner it reversed and that it closed near the high of the day shown the move had strength. Furthermore, its ETF GLD traded with extraordinary high volume. Today's move could be the trigger gold was waiting for to make another attempt at breaking above the $1000 mark. Click on the charts below to see my comments and also read my previous post on gold to see where gold might be headed.


The Oil

Conventional wisdoms would had bet that crude prices will be down since last weekend's OPEC meeting ended with no additional reduction in production output, and with this morning's EIA inventory report showing an increase of 2M barrels. But instead, it held its ground and stayed near the $50 level. Another reminder not to trade based on the obvious because the market will rarely do what is expected. From the chart, one can see the price actions are pointed toward higher prices in the near term. And in the market, price is king.


Share It

Sunday, March 15, 2009

Chopping Higher

The market has been up four consecutive days, and there are lot of skepticisms for this bear market rally to go higher. With options expiration coming up at the end of the week and a high level of skepticism, the market will continue to chop higher as hedges and protective PUTs are being close out. The SP500 is sitting slightly above the Nov 2008 low and the DJI is still approximately 300 points below its Nov 2008 low and the Nasdaq 100 has moved back into the trading range. The DJI, SP500 and Nasdaq 100 are only approximately 5% away from their next resistance level. The unwinding of the options and hedges will bring these indices to test their resistance level. If you are planning to go long, make sure to use tight stop as we are still in a bear market. I will continue to establish short term longs and hold off on any shorts until the market has reverted back into its down trend.


Gold

Ever since gold gave a false bull flag breakout, it has retraced to the trendline for support and it bounced off from the support level nicely. It is approaching the failed bull flag peak. If it can break above this peak, it could run up to the 1000 mark again.


Oil

The continuous future contract for crude is forming a saucer (rounded) bottom. The price has moved above the 50 SMA and the 50 SMA is sloping upward. The price action seems to indicate oil will go higher. Next resistance level is in the 50-55.


Share It

Tuesday, March 10, 2009

The Rally Everyone Waited For

The rally everyone waited for finally arrived. This has to be one of the most anticipated rally in recent days. Every financial news network, financial program, and talking head are saying how the market is oversold and a relief rally is imminent. I was a bit surprise that it actually occur when such high level of anticipation existed. Normally, the market does not do what is expected. Since it is here, this rally is quite different than the one from last Friday, March 6, 2009. There are much more convictions in today's rally. The advance/decline ratio is more than 10 to 1, and the up/down volume ratio is greater than 20 to 1 in the NYSE. The Nasdaq advance/decline ratio is 5 to 1, and up/down volume ratio is nearly 20 to 1. DJI closed up 379.44, SP500 closed up 43.07, and Nasdaq 100 closed up 68.57.

In order for this rally to be more than a single day event, it needs to demonstrate some sustaining powers by following through with a few more up days and possibly move the DJI back up to test the support it had broken in the 7500 level, and the SP500 back up to test the 750 level. And maybe during this bear market relief rally, some market internals will be strenghten for the market to make a bottom on its next downward move. Lets not lose sight that the bear market is still in force, and a lower low for the DJI is still to come. So let make some money on the longs from this bear market rally while it last, and keep a watchful eye on the market to see if it can put in a bottom in the latter part of March or in the month of April. If a bottom is not made within this time frame, then it will be a long tough year for the economy and a recovery in 2009 will just be a dream.

Here are the charts for the indexes with my commentary embedded, click on the image to get a larger view:


There were two weaknesses today and they were the crude oil and gold. Crude pulled back a bit from its recent run up, but that did not discourage the big oil companies from participating in today's stock market rally.


Gold fell back to under $900 an ounce and exhibited a failed bull flag pattern. The bull flag pattern failure can turn into a bear flag if it break below the trendline support. In the short term, if a position is establish either on the long or the short side, tight stop must be exercise since it is at an inflection point that it can reverse just as quick as it breaks down. But I do share the longer term view that gold will rally back up to test and break the 1000 level before the bull move is over. For now, direction is unclear. Need more confirmations on its intended direction.


Share It

Sunday, March 8, 2009

Market Extended And Oil Is On The Move

The market on Friday could be seen as a reversal day. It opened up more than 150 points on the Dow, then it drifted below 6500. In the last 30 minutes of trading, it rallied to regain all the losses and closed up little more than 32 points. It doesn't matter what we call it, short covering or bargain hunting. What is clear is the market is too extended on the downside to initiate new short positions, and might be too soon to go long. But the price actions surely indicate a relief rally is in the work. Whether it will come on Monday will be anyone's guess. But I will start cutting back on my shorts and wait for the relief rally to play itself out.


Not only the market might be getting ready for a bounce, the oil has been moving up. Looking at the light crude future contract, it appears oil could move to the 50-55 level in the short term, and the ETF USO could move above 30.


Share It