Showing posts with label MOO. Show all posts

Sunday, April 10, 2011

Things To Watch

Until the end of QE2, the market will continue to move higher. Although the recent price actions showing the market is stalling (potential pull back), but the trend remain to be up. The things to watch as the market make its next move to higher level are the continuation of rising commodities prices due to weakening US dollar. And for the market to mount a rally with conviction, the financial and the tech sector will need to participate.

The ETFs to watch are MOO (commodities), GLD (gold), TBF (short US Treasury), UUP (US dollar), XLF (financial), and SMH (semiconductor). The weekly price chart for XLF show it is forming a cup and handle price pattern, while the weekly price chart for the semiconductor sector ETF, SMH show it is working on its weekly bull flag move.


GLD (gold):


MOO (commodities):


UUP (US dollar):


TBF (20+ yrs US Treas. Short):


XLF (financial):


SMH (semiconductor):


Share It

Sunday, January 30, 2011

Things Got Dicey

Things got a bit dicey last Friday. I was expecting an interesting Friday after AMZN was hammered in the after hour trading on Thursday. When the market is extended and so many traders are just looking for an excuse to sell, it doesn’t take much. After the SP500 pushed above 1300 with a negative advance/decline along with the uncertainty from the uprising in Egypt, the traders found that to be enough reason to sell. Is this sell off the beginning of a correction?

The SP500 still appears it will close above 1300 and the DJIA is destining to move beyond 12,000. Until the SP500 close above the 1300 and the DJIA move pass 12,000 decisively or the SP500 to break below 1262, I will remain cautiously bullish. I would categorize Friday’s sell off as a pull back and I will keep a close watch on some of those stocks that were hit hard during the last couple trading sessions to bounce off their intermediate support.

SP500:


DJIA:


Nasdaq 100:


With food prices rising, the agriculture sector could be an interesting play. Here is the price chart for MOO showing how it is bouncing off its support trend line:


And one of the fertilizer stock Agrium, AGU behaving similarly as the MOO ETF:


Share It

Saturday, January 15, 2011

It Will Not Be Denied

The SP500 is telling us that it will not be denied from reaching 1300. Although it is extended, but it doesn’t mean it will falter and give up on reaching its target. As the number of market participants calling the market top increases, the less likely the market will topple. The Nasdaq broken out and entered the level that hasn’t been seen since 2001. The Russell 2000 appears to be making a run toward 850, and the DJIA is marching toward the 12000 level. Shorting the market here is foolish. Being completely bullish is being negligent. I will continue to be cautiously bullish and take whatever the market gives me. There are so many opportunities that one does not need to hold on to a trade longer than necessary. Any missed potential profits can be made up from other trade opportunities. In this extended market, the longer one holds the position, the greater the risk of being chopped on a sudden reversal.

Here are the updated charts. Click on them to get a larger view and to read the commentary.

SP500:


Nasdaq 100:


DJIA:


Russell 2000:


TBF:


UUP:


MOO:


Share It

Saturday, January 8, 2011

First Week of 2011

The first week of trading for 2011 is over and the market’s appearance is it is going higher. But internally, there are signs that said in the short term it might come back down a bit before it resume its move to higher high.

The SP500 is climbing toward the 1300 level but the divergence with the MACD could put this climb on a temporary halt.

SP500:


Similar divergence appeared on the DJIA and Nasdaq 100.

DJIA:


Nasdaq 100:


This divergence does not imply a pullback will occur, it just put out signs that momentum is slowing and a possible pull back could happen. Whenever I see this type of divergence, I move into a cautionary mode and be less aggressive on the long side.

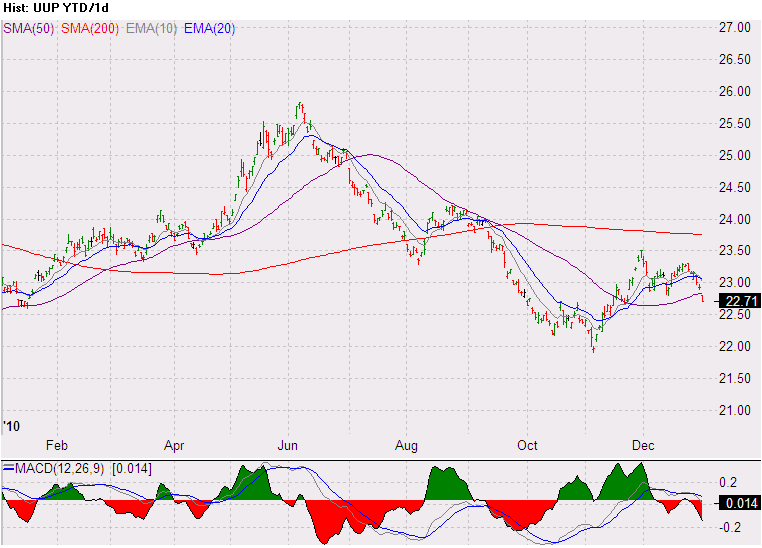
The UUP (US dollars ETF) showed some strength and broke out of a small declining price channel. The level I am watching is the high of 23.52 it made on 11/30/2010 and the 200 SMA. I will continue to consider the trend to be down until it has broken above these levels and formed a higher high/higher low pattern.

UUP:


The short US long term treasury ETF, TBF is hovering in the middle of a rising price channel and bumping up against a possible baseline resistance at 45.42. If it breaks above this level, potential upside could be the upper price channel trend line near 47.

TBF:


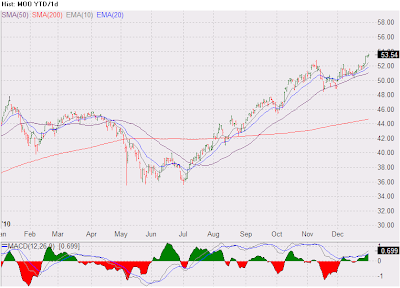
The Agri ETF, MOO continues its upward trend with upper target level near 58.

MOO:


Share It

Saturday, January 1, 2011

Happy New Year!

As we enter the New Year, I am sensing an increase of optimism. This increase of optimism is not because we have solved and righted all the economic & financial ills in the US and around the world. The US still have an unemployment rate close to 10%, huge federal budget deficit, a housing market still seeking a bottom, and many states are in a brink of default. But for whatever the reason(s), people are beginning to feel a bit more positive about the future, and that is a good thing for the future of the economy…especially a consumption economy such as the U.S.

In the beginning of 2010, I mentioned one of the things I will be watching is the US dollars, and as the Euro Zone exposed their financial problems, the US dollars strengthen. When helicopter Ben start contemplating his academic experiment of dropping money out of the sky with his QE2, the US dollars retreated. The UUP chart below shows how the US dollars ended near where it started in 2010 after it has peaked in June.

UUP:


What will I be watching in 2011? Bond! I believe the QE2 is the needle that will pop the bond market bubble. It doesn’t matter if the US decides to reduce its budget deficit, it still have to finance its debt. The arrogance of the Fed to simply print money ($600B) without any regards to those that are holding the US dollars will cause those that been financing the US debt to stop buying the US bonds. This action will force the interest rate to go up and will lead to another economic crisis down the road. One way to profit from this scenario in the market is by trading the short 20+ year treasury ETF, TBF. As US interest rates rise, bond prices will decrease and the price of TBF will increase.

TBF:


Another consequence of a devalued US dollar and rising interest rate is inflation. As inflation starts to creep up, commodities price increases will accelerate. In 2011, I will also be watching for opportunities to trade the agriculture ETF, MOO.

MOO:


While the SP500 broke through the 1250 level, it hasn’t shown any signs of topping out. although it does appear to be extended on the upside, a minor pullback when everyone are back next week will not be a big surprise to me. I’m still looking for higher high from the SP500.

SP500:


Share It