
Sunday, February 28, 2010
Waiting For Clarity
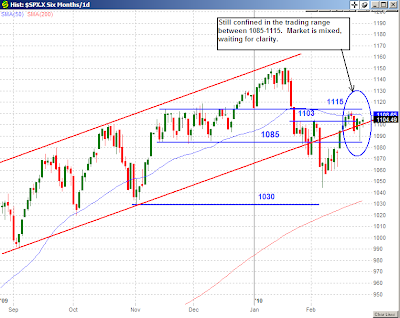
The market has been chopping around within the range bounded by its recent support and resistance level. The SP500 is confined in the 1085-1115 trading range. Until the market breaks out of this trading range and provides some clarity on its direction, I will exercise patience and limit my trading activities. Since there have not been much changes for the market indices, I will just post an updated SP500 chart. Support and resistance levels for all the indices remain unchanged.
Share It
Tweet
Sunday, February 21, 2010
Overtime
It appears the market was able to regroup after the spook from the Fed discount rate hike announcement. The SP500 was able to hold above the 1100 level, the DJI was able to keep its gains for the week and closed above its 50 SMA, and the Nasdaq 100 also was able to hold above its 50 SMA. Neither the bulls nor the bears were able to pull away. Looking at the various sectors performance, it appears there is a slight momentum favoring the bulls in the coming week. Is this momentum strong enough to carry the market back to the January, 2010 high? We’ll need to see who will win this game, and the game is currently in overtime. Keep watching the charts!
SP500:

DJIA:

Nasdaq 100:

SP500:

DJIA:

Nasdaq 100:

Share It
Tweet
Thursday, February 18, 2010
Fumble!
Yesterday the SP500 was trying to get above the 1100 level, and today it appears the SP500 was able to move above 1100 after a few pull back to the 1100 level. In the afternoon, the SP500 starts to pull away from the 1100 level and prepares to head higher by closing at 1106.75. However, shortly after the market closed, the Fed made an unexpected announcement on increasing the discount rate by 0.25% from 0.5% to 0.75%. The result of this surprise discount rate hike announcement hit the index futures on the downside almost immediately.
Using a football metaphor, the price action of the last two trading sessions is like watching two defensive oriented football teams playing against each other in the Superbowl. In the first half, the bulls have the ball and drove the ball from its 20 yard line to mid-field (SP500 1100 mark), and failing to make a first down before they have used up their set of downs, the bulls have to give up the ball to the bears. The bears use their set of downs and drove the ball back to the bull side of the field (below SP500 1100), and failing to get another first down, the bears have to give the ball back to the bulls once again. This defensive exchange goes back and forth for a few times. When the first half of the game (yesterday’s session) ended, the ball is sitting at mid-field (SP500 1099.51) In the second half (today’s session) the bulls finally able to move the ball across mid-field (above SP500 1100), but failing to make first down to keep the drive alive, the bulls have to give the ball back to the bears and the bears attempt to move the ball back onto the bulls’ side of the field (below SP500 1100.) This series of exchange go back and forth for a few times. In the 4th quarter, the bulls were able to make a few first downs on a drive and drove the ball within field goal range (SP500 closed today at 1106.75), and then the unexpected happen, a FUMBLE! (The Fed announced a 0.25% increase in the discount rate)
SP500:

15 minutes intraday SP500:

Now the bulls feel devastated and the bears are jubilated with the new found fortune. This fumble (Fed discount rate announcement) can be a game changer for either side. If the SP500 falls below 1085 like a hot knife cutting butter, then this market is going much lower and the bears claim victory. If the bulls are able to hold the SP500 at or above 1085 and ultimately move it back above 1100, then the bulls will claim victory and look for the SP500 to go higher.
So be prepare for tomorrow, it is options expiration day and those option market makers just received a big gift from the Fed. If the market react like the index futures did in after hours, then they can just let the market free fall to take out all those open interest calls without doing much pinning. I will not be surprise to see extraordinary high volatility for tomorrow. I might just be a spectator tomorrow and watch how this game ends, and then next week I go celebrate with the victor (go long if the bulls win, go short if the bear win.)
Share It
Tweet
Wednesday, February 17, 2010
Looking At The Charts
Sometime the market makes it so easy and clear for us to see what it is doing and where it is going, and sometime it disguises itself and try to throw us off. But if you look at the price charts carefully, you will see what the market is doing and get a clue on what it might do. I am not saying the charts are completely infallible, but if you look at them correctly, it will give you an edge. If you are a trader and you are not looking at the charts, then you are at a disadvantage.
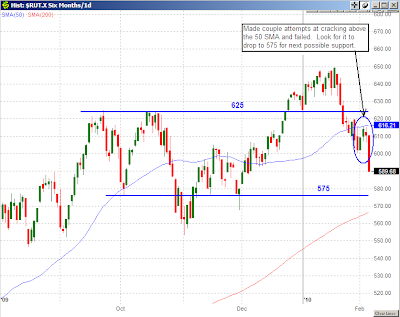
Check the charts from today and see how the SP500 hit the 1100 mark and came to a halt (make sure to look at the 15 minutes intraday chart for more detailed price action at 1100), Nasdaq 100 hit 1810 near the 1815 resistance level, the DJI hit intraday 10,320 and pulled back under the 10,315 resistance, and the Russell 2000 hit the 625 level and close near it.
The next thing to watch is how these indices react to these resistance levels. If they pull away, look for the next resistance level for reaction. If they pull back, look at those levels below these resistance levels for possible support. The market will tell us which direction it will take if you pay attention to the price action.
SP500:

15 minutes intraday SP500:

DJIA:

Nasdaq 100:

Russell 2000:

Share It
Tweet
Monday, February 15, 2010
Getting Ready For A Bounce
The market is appearing to be setting up for a bounce to test recent broken support. The DJIA is attempting to move back above 10,160 and test the 10, 315 resistance level. The SP500 is gearing up to test the 1085 support turned resistance. If it breaks above the 1085, look for possible resistance test near 1100-1103. The tech heavy Nasdaq 100 found support at the 1740 level and is preparing to test the 1815 resistance. These market indices seem to indicate a short term rally could be in the offing. My overall bias still remains bearish, but if this dead cat bounce rally present some nice short term longs, I will not hesitate to trade them for a day or two. I will not be a seller until these indices break below recent low if the dead cat bounce does not occur. Here are the updated charts:
DJIA:

SPX:

NDX:

DJIA:

SPX:

NDX:

Share It
Tweet
Thursday, February 11, 2010
Bounce, Bounce
With the unsettled news on Greece, the market is having a hay day by bouncing all over the place. This week’s price actions definitely gave some good trading opportunities to short term traders, especially to the day traders. For those that are thinking this correction is over, be careful. I'm sure there will be increasing number of talking heads coming out saying the correction is over if the market continue to bounce. Before one concludes this correction is finished, do some homework and take a look at the following charts.
DJIA:

SPX:

NDX:

RUT:

A word of caution; when a plan (whatever the plan might be) for resolving the Greece issue is finalized and announced, be on the lookout for a possible selloff. It is too obvious for the herd to think this market will go up when the Greece issue is resolved. This Greece issue will be resolved one way or another. Until it does, the market will be chopping with the news and rumors, and lot of traders that are playing the obvious are getting chop. So trade the market, not the news. My bias still remain bearish, but I'm picking off short term longs and shorts when the market present them to me until it resume its trend.
Share It
Tweet
Saturday, February 6, 2010
Taking Off For The Weekend
It looks like the shorts were taking off their positions before going into the weekend. In the first fifteen minutes of the last hour of trading on Friday, a sharp rally ensured. The Dow Jones Industrial surged up 108 points, the SP500 surged almost 13 points, and the Nasdaq 100 surged close to 23 points in a period of 15 minutes. This kind of rally can only be attributed by a short squeeze. As some of the shorts decided to flatten their book for the weekend, they created a stampede for other shorts to cover. Check out the 15 minutes intraday chart for the Q and the Spider.
SPY:

QQQQ:

What does this last hour of action mean for the market? Is this the end of the correction, is this a bull trap, or will the bears re-establish their shorts and take the market back to the level prior to last Friday, 3:00 pm EST in the coming week?
Barring any surprises or negative news from the Euro-zone over the weekend on the possible risk of default from any one of the Piigs, those candlestick pattern traders that are interpreting Friday’s print of a long wicked hammer or doji as a reversal could cause a short term rally. And then there is the possibility of those buyers thinking the recent pullback has achieved the 8-10% correction, and these buyers coming back into the market could also cause a short term rally. If one was to measure the pullback from the recent high to Friday’s low, the DJIA gave back 8.65% from 10,767.15 to 9835.31, the SP500 gave back 9.21% from 1150.45 to 1044.50, and the Nasdaq 100 gave back 9.8% from 1899.77 to 1712.89, all seem to fulfill the percentage range of a typical correction. But experience tells us the market does not reverse in such an abrupt manner especially after some key support levels have been broken, and that is why I am still remain bearish and I will be looking at any rally for opportunities to build my short positions until the market tells me otherwise.
Here are the updated charts. Click on them to get a larger view and to read the commentary.
DJIA:

SPX:

NDX:

RUT:

Share It
Tweet
Thursday, February 4, 2010
Here We Are Once Again
Here we are, back to the level where the bears left the market at the end of January 2010. The bears gave the bulls the first two trading sessions in February to show their convictions, and what the bulls were able to put together was not impressive. The rally the bulls presented lack volume and lack trending power. Rally started out strong within the first couple of hours of trading, and then the rally fizzled into a range bound mode. This gave the bears confidence these rallies have no real buying power. After the bears pushed the market to a small loss and did not see the bulls come back to defend their grounds, the bears took control today from beginning to end. The bears took the market down at will with no bulls in sights to provide any resistance. The absent of the bulls in today’s blood bath indicates there are more downsides to come. Until a sign of buyers stepping in to put up a fight, the downward move will continue. Unlike when the market was moving up from July 2009 to November 2009, when there were bears fighting the tape in anticipate an overdue correction that prevented the market making a rocket launch move. This time, there are no bulls fighting the tape to anticipate a higher high because there is no catalyst for the bulls to expect the market to go higher…so expect the market to drop sharply and quickly. Where are those talking heads pushing the “green shoot” now!
Here is the updated chart for the Dow Jones Industrial, SP500, Nasdaq 100, and the Russell 2000. I won’t be fooled into thinking it is cheap to jump in and buy right now. I will wait for the dust to settles and let the bears finish with their rampage, then see if there are any bulls stepping in before I would start to consider going long. Until then, I will remain bearish.
DJIA:

SP500:

Nasdaq 100:

Russell 2000:

Share It
Tweet
Tuesday, February 2, 2010
Game Of Chickens
The bears appear to have moved to the sideline after they sold the market down to a key support level in January. If the bulls cannot retake those support levels that were broken, then the bears will come back in and take this market down with vigorous. Don’t be fooled into thinking this market will trade sideway.
The key level that could determine whether the bulls or the bears will take control is highlighted in the following charts. Click on them to view an enlarge image and to read the commentary for the DJIA, SP500, Nasdaq 100, and the Russell 2000. Until this game of chickens between the bulls and bears is resolved, I will not be a buyer or a seller.
DJIA:

SPX:

NDX:

RUT:

Share It
Tweet
Subscribe to:
Posts (Atom)