Sunday, December 20, 2009

Standing By

The market continues to trade sideways. The Dow Jones Industrial(DJI), SP500(SPX), Nasdaq 100(NDX) are all trapped in a trading range. The only index that appears to be making a move is the Russell 2000(RUT). The Russell 2000 has been strong relative to the other indices, but it also is trading within a trading range. As the holidays approach, trading volume will start to lighten and one needs to be very careful on false breakouts.

(Click on the chart to get a larger view and for the commentary)

DJI:


SPX:


NDX:


RUT:


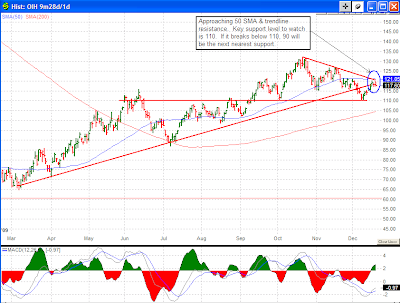
The US dollar continues to gain strength. A short term consolidation from recent move is not inconceivable. The recent price actions on the dollar indicated the low for the dollar in this cycle has been made. The catalyst to watch now is the unwinding of the dollar carry trades. Energy stocks could get hit as commodities related carry trades unwind and oil prices retrace below $70 a barrel. Gold and gold mining stocks can also get hit as the carry trades unwind. How much gold prices will retreat is depending on how the market perceives the threat of future inflation. If the market is more concern about the threat of inflation than the strength of the dollar, then gold could be shielded from the unwinding of those carry trades.

DXY:


UUP:


OIH:


I will be standing by if there is significant development in the market that warrants me to put up another post before the holidays break. Most likely this will be my last post before Christmas and I like to take this opportunity to wish everyone a merry Christmas and a happy holidays.


Share It

Thursday, December 17, 2009

What A Difference A Day Make

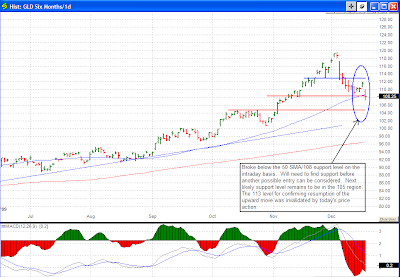
After putting gold back on a trade watch for the next upward move, the market sold it off with a drop of more than $28. Since the gold ETF dipped below the 108 support level, I will wait for the next sign from gold to tell me it is ready to resume its upward move. For now, the long entry that I was watching is off the table. The catalysts I have mentioned could still be played out in the near future. I will continue to watch for signs on which catalyst will emerge or for signs of any new catalyst for gold to move higher.

GLD


As the recent price actions from the US dollar telling us its imminent resurgence, the momentum took a leap forward and broke some major resistance today. Most of today’s drop in the price of gold was due to the strength in the dollar.

DXY


UUP


The Euro took a hit from the dollar, the Euro-dollar ETF, FXE, went below the 144 support level. If the dollar continue to regain its strength (which seem to be most likely at this point), then the unwinding of those dollar carry trades will start to accelerate.

FXE


I have mentioned the weakness in the financial sector previously, and I am continuing to be cautious on the financials. Take a look at the time frame when WFC and BAC did their secondary offering. Don’t get fooled by the false move. Their stock prices were being held up to move those papers. If one look closely at the financials, one can detect the underneath weakness in the sector. I’m staying away on buying the financials.

WFC


Share It

Wednesday, December 16, 2009

Gold & The Dollar Moving Up Together?

Continuing my observation on the US dollar and the carry trades, a slight twist has started to appear that could confuse some casual market observers. Previously I have talked about how the weak US dollar propelled the stock market, the price of oil and the price of gold. Now I’m seeing gold could be making another move upward at the same time as the dollar continues to regain its strength. This seems to contradict the weak dollar, higher commodities prices, and the strong dollar, lower commodities prices scenario.

But did you recall what I wrote back on November 16 about where the price of gold could reach? I stated in that post in order for gold to reach the next level near $1300, it will be a different catalyst other than the weak dollar. And I believe this trend change for the dollar and the price of gold to move up together is due to a new catalyst. This catalyst could be the resurgence concern on the long term inflation due to the massive liquidity the Fed has injected into market and the possible early rate hike from the Fed, or a short term catalyst like the possible preemptive military strike on Iran to remove the threat of Iran developing nuclear weapons. These possible catalysts could cause the dollar and the price of gold to move up in unison. And yes, short term, the price of oil could spike up as well due to possible short term interruption of the oil supply from the possible military action. In regardless which scenario is at play, from the price action of the dollar and the price of gold, they are definitely appear to be moving to a higher level.

Here are the latest charts with my commentary. Click on them to get a larger view.

GLD


DXY


UUP


FXE


Share It

Sunday, December 13, 2009

Continue To Watch The US Dollar

It was another week of sideway trading for the market. The weakness from the financial and energy sectors is being compensated by the strength from the tech, industrial and consumer discretionary sectors. Until this balance of power is changed, I am expecting more sideway actions to continue for the market. The catalyst that can alter the current balance of power is the US dollar.

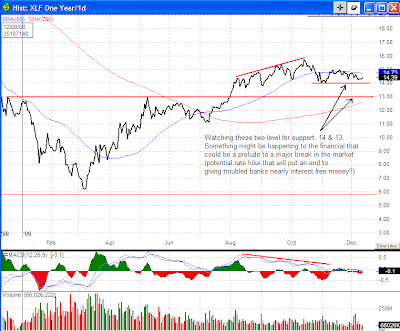
As the dollar gains strength, those dollar carry trades will be unwounded and that will bring to the end of this round of musical chair. To monitor the movement of the dollar, I have put up the following charts with key levels identified for potential breakout. In addition, I have also taken a closer look at the financial. It appears something might be developing that could cause a major break for the market. Whatever that might be, only time will tell. For now, one might take a look at some individual stocks in this sector, i.e. GS, WFC, JEF, JPM, MS, and BAC, to get a sense of the developing weakness in this sector. I will post more about the financial and some possible scenarios to watch for 2010. In the meantime, here are the charts. Click on them to get a larger view of the chart.

DXY


UUP


FXE


OIH


USO


GLD


XLF


Share It

Tuesday, December 8, 2009

The Return Of The US Dollar

This is my first post since my return from the Far East. Looks like the market still sitting around where it was 2 weeks ago before I left for the trip. The market did not experience any major changes in its technical. The DJI encountered resistance when it reached the weekly bull flag measured move level of 10,500, and the SP500 still unable to move to 1150 level. But the buzz in the market is beginning to change. As we’re all aware the recent rally is fueled by the weak dollar, causing oil, gold and equities to rise. This dollar carry trade has reached a point that is causing lot of anxieties for many traders due to the recent sign of the US dollar regaining some strength.

Since I am still in the process of getting myself back into the rhythm of the market, rather than repeating what I have posted 2 weeks ago, I decided to take this opportunity to talk about the US dollar and some of the dollar vs. other currency ETFs for possible trade opportunities and/or for monitoring the unwinding of the dollar carry trades that could signal the stock market reversal or next rally.

The following chart is the DXY, a US dollar index. Since late September, a divergence between the price and the MACD has developed, and recently price of this index broke above a downtrend resistance. These two technical observations presented a first sign that the US dollar could be reversing back toward the upside (strong US dollar).


Here is the chart of an ETF that track the US dollar, UUP. It too shows the same technical sign.


Here is an ETF that track the US dollar vs. the Euro. Look at the divergence it has developed between the price of the index and its MACD since late September, and the recent break down below the upward supporting trend line. This is another indication the dollar is strengthen.


Last chart is the dollar vs. the yen. This index has been trading within an upward price channel. It too appears to be heading back toward the upper price channel.


All these charts show the US dollar is gaining strength recently. If it continues to gain strength and move against the Euro and the Yen, the unwinding of the dollar carry trades can be vicious and volatile since the cheap dollar have created a very crowded one sided position, and when everyone is heading out the door, lot of people will be trampled on the unwinding. If one is looking for trading opportunities when the dollar carry trades are being unwound, consider these ETF that short the market index; DOG for shorting the DJI, SH for shorting the SP500, PSQ for shorting the Nasdaq 100, and the RWM for shorting the Russell 2000. I wouldn’t trade the ultra-short ETF (those 2X or 3X) of the respective market index due to the compounding effect. Stick with the 1X short ETF. Even if I’m not trading these short ETF, I will monitor these dollar/currency ETF for possible sign of the imminent dollar carry trade unwinding.


Share It

Monday, November 16, 2009

Where Is Gold Going?

I was asked where do I see gold will be heading. Looking at the inverted head and shoulder pattern that took more than a year to develop, the measured move for the gold ETF, GLD is in the 131 region. This translate to gold prices above 1300 an ounce. I have been hearing some talking head projecting 1400 an ounce. So we'll see. I don't believe the weak US dollar will carry gold to the 1300 level. It will most likely be some other catalyst to move gold up to the 1300 level and above.

GLD:


Share It

Back To Neutral

Today, the market continues its march to higher ground. The Dow 30 closed at another new high, bringing along with it this time is the SP500, NYA, NDX, and more importantly the Dow Transport. The reason for the importance on having the DJT confirming the DJI new high is it tells me the DJI will make newer high before this rally terminate. Today’s confirmation by the DJT removes the bearish stance and put the market back to neutral for me. I will revert back to bullish stance after some of the divergence has been removed. Still there are sectors continue to lag and the Russell 2000 still trading below its recent high.

Here are the updated charts. The DJI and SP500 are getting near their weekly bull flag measured move. These measured move levels will likely be the near term target for the DJI & SP500.

DJI:


DJT:


SPX:


NYA:


NDX:


Share It

Sunday, November 15, 2009

The Fallen Leader

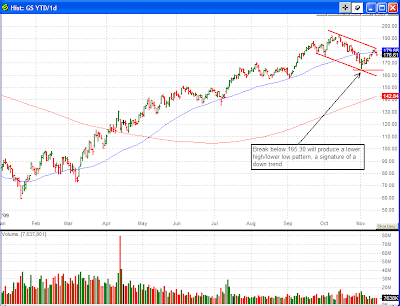
Until recently, financial sector has been one of the leading sectors that help drove the market to the October high. Now, the financial is no longer one of the main catalysts that are pushing the market to its recent high. Take a look at the financial ETF, XLF, and the top four holdings in the XLF; JPM, BAC, WFC and GS, and you can see the head & shoulder price pattern are being form on JPM and WFC, and lower high/lower low trend is being form on BAC and GS. These bearish price patterns can eventually lead the market down. As one sector fall, others will follow. Be very cautious on the financial.

Here are the charts:


XLF:


JPM:


BAC:


WFC:


GS:


Share It

Saturday, November 14, 2009

Waiting For Confirmation

Although the market ended another week with a gain, but the market did it with a lot of uncertainties. In the intraday chart, signals are being flashed by some broad market indices warning of an impending price trend change and other market indices continue to march higher. In the daily price chart, incomplete bearish price patterns temper the bullishness. And the weekly price charts show the uptrend price channel started in March 2009 remain intact.

It is moment like this that the traders must look at the technical from multiple time frames to get a complete picture (if multiple time frames are not part of the routine review). In my recent post on my blog, I have pointed out some of the bearish signs from my review of the intraday and daily price charts, and in this post I will present my review on the weekly price chart.

The market based on the weekly chart still appear to be on the upward trend, but I am still in the mildly bearish side due to conflicting signals from the intraday and daily price charts. I will be completely bearish when the market gives me a full confirmation it is heading down. If the market takes out those potential bearish price patterns that I am monitoring, then I will revert back to the bullish camp.

Here are the weekly charts showing potential target level from previous bullish pattern formations. Be careful on interpreting the measured move projections. I normally consider a projected move have attained its target if it has made 85% of its measured move. In other word, I don’t necessary wait for the price to reach the projected price level before I terminate the pattern if there are conflicting technical.


DJI:


SP500:


Nasdaq 100:


Russell 2000:


Share It

Thursday, November 12, 2009

Another Turn Is Coming

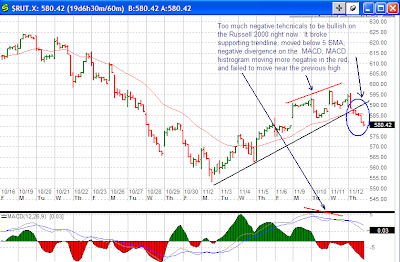
You can sense the recent rally is running out of steam, and today it shows. In this post, I will simply highlight some of my observations on the intraday hourly price chart to show the price trend is getting ready for another turn downward. Whether this is another pull back or this will turn into a price reversal, I will not draw any conclusion one way or the other until after the daily price patterns are completed. For now, I will remain in the mildly bearish camp.

Here are the charts with my observations. Click on the chart to get a larger view to read my commentary.

DJIA:


SPX:


NDX:


RUT:


Share It

Wednesday, November 11, 2009

Continue To Be On The Alert

Today the DJI closed with another new rally high at 10,291.26. Although this time the SP500 did sneak in a new high by closing at 1098.51, 0.60 point above the previous closing high of 1097.91 made on 10/19/2009, and the Nasdaq 100 continues to close at a new high along with the DJI. But the DJT, NYA, and the Russell 2000 continue to lag and failed to close with a new rally high. Until the DJT and NYA confirm DJI newer high, I will remain to be on the alert for potential downside reversal.

Here are the updated charts showing the latest closing level:

DJI:


SP500:


Nasdaq 100 (NDX):


DJT:


NYA:


Russell 2000 (RUT):


Share It