Friday, May 29, 2009

Are You Crazy?

Another week of chopping in the market. It appears we are locked in a trading range. But look what the weekly charts might be telling us. After you have read what I'm about to say, you probably will ask "Are you crazy?"

Don't get me wrong. I still believe this is a bear market rally. I don't try to forecast or predict what the market will do, or when it will do it. I simply listen to the market and interpret what it has to say, and then I formulate scenarios to deal with whichever direction the market decides to take. Sometime my interpretation could be completely incorrect. And I will be the first one to tell you that have happen more often than not. I have said it before, it is not about being right in calling the market, it is about being on the right side of the trade to make money. So here is what I'm seeing as a possibility. DJI to be above 10000, the SP500 in the 1150 range, and the Nasdaq 100 near 1600. "WHAT! Are you crazy?" You might think I got chopped by the market so badly that I start seeing things. No, the last couple of months I have been quite profitable...thank you very much. And no, I'm not crazy. Read on...

If the bull flag on the weekly chart for the DJI and the SP500 developed and played itself out, then the measured move put the DJI above 10000 and the SP500 at 1150. And the measured move from the double bottom on the Nasdaq 100 will put this index near the 1600 level if this rally is to be continued.

Is it possible for a bear market rally to make this kind of move? What is the reason for such a move to be possible? The reason for these indexes to reach these unthinkable levels (at the present time) will be the same reason for crude oil to reach $65 a barrel today. I don't need to tell you the answer, you know the answer. Go read what I said about crude oil prices from this post I wrote back in mid April of this year. Was the projected price I saw far fetch now? Who would have thought it could have reached $65 a barrel today.




Share It

Saturday, May 23, 2009

Still Chopping Around

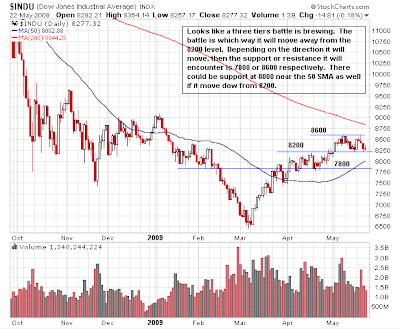
I thought the bounce off the SP500 878 level would get things moving on the upside. As it turns out, the market simply refuse to go anywhere. The indexes have been chopping around the 8200, 875, 1360 for the DJI, SP500 and Nasdaq 100 respectively for more than 1 1/2 months.


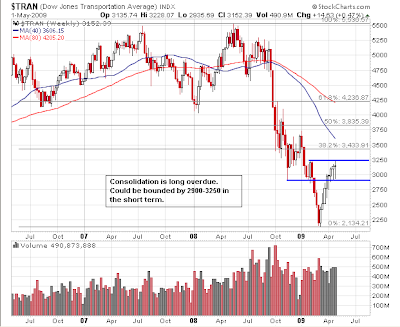
But, things are getting interesting with the DJT. A down trend could be forming on this index. Not sure if it is due to the market finally realize the anticipated recovery is not coming soon or the crude oil prices moving above $60 a barrel due to weak US dollars caused the transport to weaken. My take is the market is starting to realize the economy is still far away from recovering. No matter what wimpy term, i.e. "geen shoot" these talking heads decide to propagate, things cannot be getting better if it is still less bad or going down less than before. To me, its not "green shoot" we are seeing, it is a "crap shoot" through all these bailouts, stimulus, and proposals various central banks, governments, and politicians are implementing and/or considering. So keep an eye on the DJT. It could be telling us something about what to come for the rest of the market (hint: Dow Theory).


Share It

Monday, May 18, 2009

Checking For Answers

The market moved higher today after last week's pullback. Is this the move that will give us an answer to which direction the market is heading in the near term? Let’s check the answer sheet.

The SP500 stayed above 875 and moved back above 900. The DJI also moved back above the 8400 level, and the Nasdaq 100 is back above its 200 SMA and above the 1380 level. Although trading volume is on the light side, I would say from the first check of the answer sheet, the direction is up.

The critical thing to watch is the trading volume. As the market continues to move up, trading volume needs to pick up. Otherwise, there will not be enough momentum to carry the market to the next resistance level. When we see volume increase, which will be the clue that money is coming back into the market, we should see some big move as skeptics rush back in. Until the market tells me otherwise, I will be on the long side.


Share It

Sunday, May 17, 2009

More Questions

Finally, the market has pulled back. The SP500 bounced off an intraday low of 878.94, less than four points from the 875 level many market participants were watching for test of support. Is this it for those that have been waiting for the dip to buy into this bear market rally? The Nasdaq 100 broke below its 200 SMA support. Will it climb back above the 200 SMA or dip down to find support at 1280 level? And the DJI went below the 8400 support. Will those last holdout skeptics and the buy-the-dip crowds finally get pulled into this rally and push the DJI up to the 9000 level? Lets see if the market will answer these questions next week.


Until the market has answered, I will continue to trade cautiously with reduced position size and tight stops.


Share It

Monday, May 11, 2009

Still Unresolved

After a week has gone by, the market still has not decided on which direction it is going to take in the near term. The DJI is still testing the 8400 level for support, and the SP500 is consolidating at the 910/920 level trying to decide whether to break above the trend line and move up to test the 200 SMA at the 950 level or pull back to the 870/880 range to test for support. The Nasdaq 100 broke through the 200 SMA and pull back to test it for support. It appears it is getting ready to move up to the 1470-1480 level if it hold above the 1380. Until the market has decided to move one way or the other, the direction for the market in the near term is still unresolved.


Share It

Tuesday, May 5, 2009

Waiting Again

Here we are waiting for the market to decide which direction it wants to move after the SP500 broke above the 875 level. Yesterday, the first session after the SP500 closed above the 875 level, the market displayed strengths on the opening hour and the last trading hour. Then today, the market really did not do much other than give back a small portion of yesterday’s gains. Even that was not very eventful, as the closing minutes was near, the market rallied back to recoup majority of the trading session losses.

Looking at the candlestick chart for the DJIA, SP500, and the Nasdaq 100, one can see today’s price actions from all three indices formed a doji type of candle. This type of candle appears when there is indecision amongst the buyers and the sellers (bulls & bears), and it is a prelude to a new trend, may it be up or down. Rather than try to guess which way the market will be headed, I will take the sideline and wait for the market to make its move then trade accordingly. There is lot of jittered bulls feeling the market is extended and simply looking for an excuse to take profits. Then there are those that felt the SP500 closed above 875 and into the 900 level shows the market have more upside to go. Like any good student of the market, I have mapped out the scenario for the upside and the downside. Therefore, whichever direction the market decides to take, I will be ready.

The scenario I have for the DJI on the upside is moving into the range between 8900-9100, nearing the 200 SMA. On the downside, if the market decided to pullback and consolidate, it could pull the DJI back to the 7500-7750 area after a minor test of support at 8000.


For the SP500 on the upside, the next probable resistance level is 920/940. On the downside, if it does not hold above 875, it could retrace back down to the 800 level.


Finally, the upside for the Nasdaq 100 is 1470 near the 1500 level. There could be a minor test of support at 1380 before it breakout on the upside or the downside. If the Nasdaq moves below 1380, then it probably will not find support until it reaches the 1280 or the 1140 level.


These are the possible upside and downside scenarios I will be watching in the coming days. No matter which way the market decides to move, the next move will be dramatic. So prepare for some volatility.


Share It

Monday, May 4, 2009

How Long Can This Last?

Last Friday, the SP500 closed above the 875 resistance level and today the market surged ahead toward the next potential resistance level. Rather than repeating those levels here, I will refer you to go review these post, "To Be Continued.." and "Everyone Is Watching" for the resistance levels.

This bear market rally has defied many skeptics, and even the believers are now questioning how long this rally can last without a serious pullback. The longer this market continues to move higher, the riskier it gets for both the bulls and the bears. The rally is now entering into its eighth weeks. Being so extended, it is simply too risky to open new longs (unless you are day trading) and too early to go short. Under this condition, I would rather miss a few hundred points rally on the Dow than getting bull trapped. Like the musical chairs analogy I used in my previous post, it's not a matter of 'if' the music stops; it is a matter of 'when' the music stops. We all know a pullback is forth coming, we just don't know when and how extensive it will be.

Here are how the charts look like after today's rally:


Share It

Friday, May 1, 2009

Here We Go Again

If the market doesn't involve money, some of the things it does will be outright amusing. But since it is all about money, one must be alert to some of the things the market does in order to avoid being caught on the wrong side. Here is one of those things that will make you pay if you are not alert of its happening.

Today the SP500 finally closed above the 875 level that so many market participants and talking heads have been waiting for. During the last couple trading sessions, the market has been testing the 875 level many times, and one can sense the jitters and the rattled nerves when the market approach the 875 level. The price actions have been like a game of musical chairs. All the players in the game know the music will eventually stop. Some of the players are so nerve wrecked, they try to anticipate the stopping of the music by sitting down before the music actually stop. After they sat down and realized the music hasn't stopped yet, they get back up and follow the rest of the crowd until another nerve gets wrecked, and this process repeat itself until the music finally stop.

The price actions on Thursday, April 30, 2009 trading session is like a game of musical chairs with a bunch of nervous players. The market move above the 875 and some players decided to sell to avoid ending up holding the bag when the market sell off. After they sold, they realized the market is not ready to sell off, so they join back in with the rest of the crowd and push the market back above the 875. This process was repeated multiple times throughout the session.

Today, May 1, 2009, the music stopped. Five minutes before the close, SP500 was struggling to close with a modest gain at 873, then a last minute push was made to push the SP500 to close at 877.52. This last minute push to help the SP500 closed above the 875 level reminded me what took place on January 30, 2009 when a last minute push was made to prevent the DJI from closing below the psychological support level of 8000. We all know what followed after this artificially support was made for the DJI 8000 level.

So, here we go again. The market removed a question mark for the skeptics to enter the market by closing above the 875 level. How much conviction is behind this close above 875 on the SP500 will be revealed in the coming week. Is it a breakout or a head fake. If it is anything like the January 30, 2009 efforts to hold the DJI above 8000, then get ready for a wild ride down.

Since there hasn't been any dramatic changes in the daily charts, I have decided to put up the weekly chart to get a different perspective on the price levels. Here is the SP500 weekly chart:


The DJI weekly chart:


The DJT weekly chart:


The Nasdaq 100 weekly chart:


The Russell 2000 weekly chart:


The weekly charts show how these widely watched indices have been positive for multiple consecutive weeks. The market is definitely over extended, and with the SP500 finally closed above the 875 resistance level, it won't be long before the long awaited pullback to occur. When the pullback arrives, will it be a pullback or a reversal. While I'm waiting for the market to show its move, I will be managing my opened long positions with very tight stops and preparing to take the short side if the market decided to reverse.

Keep a close watch on the market next week and trade cautiously. Be on the lookout for increasing volatilities.


Share It