Sunday, March 21, 2010

It Did Not Disappoint

From my previous post, I have indicated the Dow Jones Transportation index told us the Dow Jones Industrial will move to its January 2009 high, and true to its form, the DJIA did not disappoint those Dow Theory watchers. Not only it has reached the January 2009 high, the DJIA surpassed it and moved to the bull flag measured move level of 10,800 intraday on Friday.

DJIA:


With the quadruple witching away, now the focus will be back to watching the price actions and listening to what the market has to say. The three primary sectors I am monitoring for signs on where the market is heading are; financial, energy, and the technology. The latest price actions from the XLF, XLE, and XLK, ETF for the financial, energy, and technology respectively are telling me a pullback is on its way. These ETFs along with many stocks have reached their price target level and started to weaken.

XLF:


XLE:


XLK:


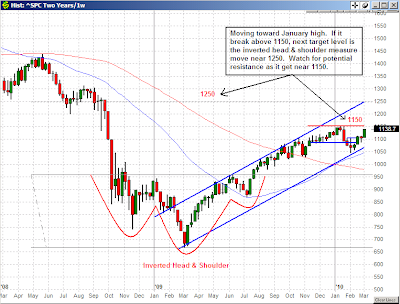
Does this pullback signal the end of the rally? From the noise in the market about 1250 for the SP500, I doubt this pullback will put an end to this rally. If you have been following this blog for a while, you would have known this 1250 level is the measured move of the inverted head & shoulder pattern formed last year. Having many traders talking about this 1250 level, this level has become a target (we know what happen to targets…they get hit.)

SP500:


Before the SP500 will make a move toward this 1250 level, it has to complete the pullback it has started last week. The level of support for the SP500 in the near term is the 1115-1130. Look for this level to show some reactions. If it fails to find support at this level, then look for next potential support near 1085. For the near term, a lot of profits need to be shaken out. Therefore, I am taking the short side.


Share It

Saturday, March 13, 2010

No Surprises

There were no surprises from last week’s market performance. All the major market indices except DJIA hit their mark. The SP500 was nudged into a new closing high by exceeding the January closing high with 0.01 of a point at the closing bell. Believe what you want, manufactured or coincidence.

Next week is options expiration week and with so many stocks extended, I will be prepared for a potential pullback.

Here are the updated charts:

SP500:


DJIA:


DJT:


Nasdaq 100:


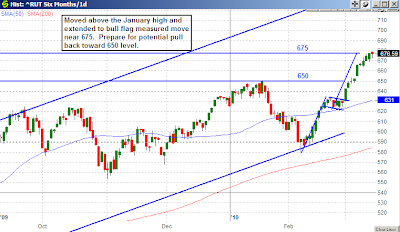
Russell 2000:


Share It

Tuesday, March 9, 2010

One Price Break, Many Trading Opportunities

When RIMM broke out of the $72 resistance level on Monday, 3/8/2010, it has triggered a number of trading patterns for different trading strategy and I thought it might be interesting to identify them for suitable trading strategy.

(click on the chart for a larger image)


Starting with the blue color and letter code ‘A’, this pattern is a ‘bullish triangle’. This ‘bullish triangle’ pattern has a measured move price target near the $88 level, which is the same price target level from a recent analyst upgrade. This type of pattern is more of a medium term trading strategy and most likely be traded by medium term swing traders that primary trade breakouts.

The next pattern is a ‘gap fill’ pattern, depicted by the color aqua and letter code ‘B’. This gap is approximately $10 wide and most likely be traded by short term and medium term swing traders that trade gaps. It is reasonable to expect RIMM to fill a $10 gap within days since it has a high volatility.

Next is the ‘cup & handle’ pattern colored in green and marked by letter code ‘E’. This is another breakout pattern play for medium term swing traders. This ‘cup & handle’ pattern has a measured move price level near $82.50, which also coincide with the upper gap level.

Finally, the ‘trendline breakout’ colored in black with letter code ‘F’. This pattern is for day-traders or short-term traders with holding period of no more than a few days.

The chart is highlighted with two additional patterns that were not triggered by the recent price breakout. I have highlighted them to illustrate the trading patterns prior to the breakout.

The pattern marked by the color of red and letter code ‘C’ is a ‘bull flag’ pattern. The measured moved place it near $74, a price level that was reached after it has broken out of $72. This is another trading pattern for medium term swing traders.

The price channel pattern highlighted in purple and letter code ‘F’. Medium term swing traders that buy on weakness and sell on strength will likely trade these price channel patterns.

So depends on what type of trading strategy you are trading, the recent breakout from RIMM provides trading opportunity to many different strategies. It is rare for so many trading patterns triggered by a single price breakout.

Caveat: Although these trading patterns have a measured price target, but it doesn't mean the target will be hit. All it means is there is a potential for the price to reach the target level and we still need to use our trading plan to trade these patterns.


Share It

Sunday, March 7, 2010

Back In Play

The market finished the week strongly with a convincing move above its resistance level. The SP500 moved above its resistance level of 1115 and it is heading toward the January high near the 1150. Similarly for the DJIA, NASDAQ 100, and the Russell 2000, they have also moved above their resistance level. The Russell 2000 has broken above its January high. But look at what is back in play, the measure move from the inverted head & shoulder pattern that was formed between October 2008 and August 2009 for the SP500, DJIA, and the Russell 2000.

Here are the updated weekly charts with the inverted head & shoulder pattern highlighted and the measure move target from the inverted head & shoulder pattern.

SP500:


DJIA:


Nasdaq 100:


Russell 200:


Although the market has signaled it wants to go higher, but there are lot of stocks near intermediate resistance level. I will be watching how these resistance levels are handled because they can easily cause a short term reversal especially after a recent strong run-up.


Share It

Tuesday, March 2, 2010

I'm Not Convince

The SP500 moved above the 1120 level, something I said the market needs to show us in order to give us some clarity on its direction. But the manner it moved and tried to hold that level today was not convincing to me that the market is ready to move higher. The 15 minutes intraday chart shows how it faded in the afternoon, which is why we never try to anticipate what the market might do. Always wait for the market to tell us what its intention is.

SP500 Intraday 15 Minutes:


SP500:


Share It

Monday, March 1, 2010

Here We Are Once Again

The SP500 is at the 1115 level once again. From the 15 minutes intraday chart, one can see how strong the 1115 resistance is throughout the session. The index was unable to stay above the 1115 level until near the close.

SP500 15 minutes chart:


If it is unable to hold above the 1115 resistance level and unable to move toward the 1130 level, then it will most likely retrace back down to test the 1085 support level. If a strong move above the 1120 level occurs tomorrow, then that can be the clarity from the market we've been waiting for. Stay tune!

SP500 daily chart:


Share It