The market continues to split between the large cap/value stocks and the small cap/growth stocks. Although the Russell 2000 show a mimic of relative strength today, but don’t let this deceive you. Here is the chart of the NYSE advance/decline vs. the SP500.
Showing posts with label compx. Show all posts
Showing posts with label compx. Show all posts
Friday, May 2, 2014
Saturday, April 12, 2014
Spooky Round Numbers
Last Friday, the market was trying to hold its ground and trying to stay in the green throughout the day until the late afternoon. As the market headed toward the close, the bottom fell off and the entire market sold off once again. The price actions pretty much play out to a scenario we have discussed in the previous video. Now for next week, the key levels to watch are those psychological round number levels. For the DJIA, the round number is 16,000, 1800 for the SP500, 1100 for the Russell 2000, and the 4000 for the Nasdaq Composite.
Share It
Tweet

Wednesday, March 6, 2013
Historical Day For The Market
The DJI made history on 3/5/2013 by closing with a new all time high at 14,253.80, surpassing the previous all time high made on 10/9/2007 at 14,164.53. This new all time high on the DJI also confirmed by a new all time high from the DJT. The DJT closed at 6136.72. Based on the Dow Theory, this confirmation indicates potential newer high to come for the DJI.
Here is a video recapping the market indices and reviewing AAPL NFLX GOOG AMZN FB.
note: The chart for the DJT in the video did not include the 3/5/2012 price bar. See the chart below for the updated DJT chart.

Click here to view the video if you do not see a video player on your screen.
Here is a video recapping the market indices and reviewing AAPL NFLX GOOG AMZN FB.
note: The chart for the DJT in the video did not include the 3/5/2012 price bar. See the chart below for the updated DJT chart.

Click here to view the video if you do not see a video player on your screen.
Share It
Tweet
Saturday, March 2, 2013
Did You See It!
There it is, another new 52 weeks high for the DJI. Did you celebrate this new high with all those talking heads? Strange how little attention and fanfare this new 52 weeks high received. If you were watching the DJI during the closing minutes of the last trading session, you would have notice how it was fluctuating between the previous 52 weeks high before it sneaked up and closed above it. Strange or deceptive? The market can't hide its action but it will try to be deceptive to fool most of the market participants.
Here is a video on some possible scenario for the market and the index ETF.
Click here to view the video if you do not see a video player on your screen.
Disclosure: Long SPY PUT
Here is a video on some possible scenario for the market and the index ETF.
Click here to view the video if you do not see a video player on your screen.
Disclosure: Long SPY PUT
Share It
Tweet
Sunday, March 8, 2009
Market Extended And Oil Is On The Move
The market on Friday could be seen as a reversal day. It opened up more than 150 points on the Dow, then it drifted below 6500. In the last 30 minutes of trading, it rallied to regain all the losses and closed up little more than 32 points. It doesn't matter what we call it, short covering or bargain hunting. What is clear is the market is too extended on the downside to initiate new short positions, and might be too soon to go long. But the price actions surely indicate a relief rally is in the work. Whether it will come on Monday will be anyone's guess. But I will start cutting back on my shorts and wait for the relief rally to play itself out.


Not only the market might be getting ready for a bounce, the oil has been moving up. Looking at the light crude future contract, it appears oil could move to the 50-55 level in the short term, and the ETF USO could move above 30.


Not only the market might be getting ready for a bounce, the oil has been moving up. Looking at the light crude future contract, it appears oil could move to the 50-55 level in the short term, and the ETF USO could move above 30.


Share It
Tweet
Monday, March 2, 2009
Back To 1996?
The SP500 dropped below the April 11, 1997 low today. I have mentioned in one of my earlier post that if the DJI drop to its April 11, 1997 low of 6391.69, the SP500 will be much lower than 737.65. The question is how low? Well, no one know. But looking at the 30 years monthly chart for the market indices, the levels in the month of July to September 1996 could be some possibilities for the DJI & SP500. Although it is too early to draw any conclusion that the SP500 will go down to the range of 625-650, and the DJI to the range of 5300-5600. But those are some of the key range to watch for. Here are the charts. I have circled what I believe are key levels and note how the Fibonacci retracement levels coincide with most of these key levels.
Click on the chart for a larger view.
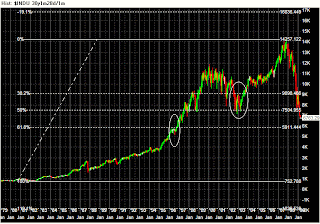


Click on the chart for a larger view.


Share It
Tweet
Tuesday, October 28, 2008
What Now O'Dow!
Woohoo, another 900 points rally in the Dow.
I hope you were on the right side of the trade today. If you were one of those that were shorting the market and didn't have a stop in place, I feel your pain. If you are one of those that sold your long positions prior to this rally and feeling you have missed an opportunity to make some big profits or to have avoided on taken some losses, I know exactly how you feel. I have experienced these feelings many times in the past, and they are not very pleasant. But, through the years as a student of the market, I have learned the hard way on how to minimize having these feelings by having a trading plan and having an anticipation on what to expect from the market (notice I didn't say 'avoid' because I still get caught up in the moment and violate or ignore the good trading practices and get trapped into these market events on the wrong side of the trade from time to time.)
If you have followed my blog, you probably already know my trading plan and my market anticipations. I have said in this post that I am keeping an eye for a countertrend long trade on GLD, and in this post I have stated what are my anticipations on the market. If you haven't been following my blog, then I highly recommend you to read those 2 posts before continue reading this post.
Now that you know which scenario the market has decided to play out, here are my anticipations on where the market might encounter resistance and potentially offer the opportunity to set a trade.
 As you can see from the chart for the Dow (INDU), it has broken above the trendline today. To get some idea where the Dow might encounter resistance and potentially revert back into the primary down trend, I applied the Fibonacci retracement between the high made on 9/19/08 and the 10/10/08 low. From the Fib retracement, it gives possible resistance levels around 9621, 9721, 10,182, and 10,837. Using traditional classic technical analysis, one can also extract these resistance levels from previous resistance and support levels, and they are near 9260, 9794, 10,365 and 11,100. As you can see, both technique yielded similar levels.
The following charts show the Fib retracement for the SP500, NASDAQ Composite, NASDAQ 100, and the Russell 2000. I will be watching how the market react when it reaches any one of these levels for signal to go short on the market. Of course, all these resistance levels will become irrelevant if the market decided to simply turn around and head down to break below the support level established by the 10/10/08 low. Then the other scenario will be followed for shorting the market. So until the market give a signal that it is on its way to make a new low, the question remain, "what now O'Dow."


I hope you were on the right side of the trade today. If you were one of those that were shorting the market and didn't have a stop in place, I feel your pain. If you are one of those that sold your long positions prior to this rally and feeling you have missed an opportunity to make some big profits or to have avoided on taken some losses, I know exactly how you feel. I have experienced these feelings many times in the past, and they are not very pleasant. But, through the years as a student of the market, I have learned the hard way on how to minimize having these feelings by having a trading plan and having an anticipation on what to expect from the market (notice I didn't say 'avoid' because I still get caught up in the moment and violate or ignore the good trading practices and get trapped into these market events on the wrong side of the trade from time to time.)
If you have followed my blog, you probably already know my trading plan and my market anticipations. I have said in this post that I am keeping an eye for a countertrend long trade on GLD, and in this post I have stated what are my anticipations on the market. If you haven't been following my blog, then I highly recommend you to read those 2 posts before continue reading this post.
Now that you know which scenario the market has decided to play out, here are my anticipations on where the market might encounter resistance and potentially offer the opportunity to set a trade.
 As you can see from the chart for the Dow (INDU), it has broken above the trendline today. To get some idea where the Dow might encounter resistance and potentially revert back into the primary down trend, I applied the Fibonacci retracement between the high made on 9/19/08 and the 10/10/08 low. From the Fib retracement, it gives possible resistance levels around 9621, 9721, 10,182, and 10,837. Using traditional classic technical analysis, one can also extract these resistance levels from previous resistance and support levels, and they are near 9260, 9794, 10,365 and 11,100. As you can see, both technique yielded similar levels.
The following charts show the Fib retracement for the SP500, NASDAQ Composite, NASDAQ 100, and the Russell 2000. I will be watching how the market react when it reaches any one of these levels for signal to go short on the market. Of course, all these resistance levels will become irrelevant if the market decided to simply turn around and head down to break below the support level established by the 10/10/08 low. Then the other scenario will be followed for shorting the market. So until the market give a signal that it is on its way to make a new low, the question remain, "what now O'Dow."


Share It
Tweet
Sunday, October 19, 2008
What's Next?
Here is what I'm watching. The charts I have put up for the major indices look very similar to each other. Each one of them are in a "what's next" state. They all can come down and test the October 10, 2008 low or break above the trendline and move higher than the October 13, 2008 intraday high. Where the market will headed will depend on what the market decided to do...test the recent low or break above the recent high.


Share It
Tweet
Subscribe to:
Posts (Atom)