Tuesday, June 30, 2009

There They Go Again

The phrase from the late President Ronald Reagan, “There they go again,” seems to be appropriate for describing the latest cry from the market talking heads. A few weeks ago before the market started to pull back, these talking heads are pretending to be market technician and start describing to viewers about how the SP500 is forming an inverted head & shoulder pattern. Now that the market is showing some signs of pulling back or consolidation, these same talking heads are telling people that the SP500 has stalled and it is forming a head & shoulder pattern.

I’m not saying the SP500 could not be forming a head & shoulder pattern. From the SP500 daily chart, I have illustrated the SP500 can just as easily be forming a ‘W’, double bottom pattern from the current price actions.


The point is who is to know what price pattern the SP500 will form until it has made that pattern. All one can do is be on the lookout for possible price pattern and have trading plan ready if a particular price pattern developed. Another key point to remember is the market rarely do what everyone is expect it to do. Therefore, if majority of the market participants are expecting a H&S pattern, then the likelihood for it to form the H&S will be low.

What difference does it makes for what pattern it will form, you might ask. The difference is SP500 rises to 1000 or the SP500 falls to 800. Therefore, if you are listening to the talking heads and playing the market as it is going to form a head & shoulder, then you will be ripped if those talking heads’ prediction is incorrect.

Who is to say these talking heads can’t be right. If these talking heads continue guessing, one of these days, they will guess right. After all, the market is all about probabilities. To win, we just need to learn how to play the edge and manage risk. Guessing is not an effective way to gain an edge or manage risk. While the market is being indecisive, I will trade cautiously with reduced position size and tighter stop.


Share It

Friday, June 26, 2009

Rough Start

After a rough start at the beginning of the week, the market finished the week with somewhat of a mixed picture. The DJIA gave back little bit more than 1%, approximately 101 points for the week by closing around 9438. The SP500 is essentially flat, losing 0.25% or approximately 2 points and closed near the 919, and the Nasdaq 100 gained about 9 points or 0.6% by closing out the week at 1480. On the surface, these point losses do not appear to be significant, but the manner in which the market has behaved throughout the week is worth a second look.

Prior to Monday, the three major indices, DJIA, SP500 and Nasdaq 100 were riding on their upward trend line. When the week starts, the DJIA encountered three consecutive down days that took it down to near the 8250 level to find support. On Thursday, all three indices went up for the first time (the only time) this week and bought the DJIA back to the 200 SMA to test for resistance. The SP500 did not do too much better than the DJIA. It has broken below the 50 and 200 SMA before it bounces back above these two moving averages. Now, the SP500 is approaching the 925-930 resistance level where this level was previously its support. Not all is negative for the SP500. During the course of this correction, the SP500 50 SMA did crossed over the 200 SMA, but with a very weak (almost flat) up slope. The only index that seems to show some strength is the Nasdaq 100. After it has come down and tested the 50 SMA for support, it has recovered all its earlier losses and ended up with a small net gain for the week.


Next week will probably be another nail biter. Any signs of the DJIA fails to reassert and hold above the 200 SMA, and the SP500 unable to reclaim the 930 level, the bears will jump in and pound on them to retest those critical support levels I have indicated from my previous post. The only danger for the Nasdaq 100 is that it might be dragged down by the down draft from the DJIA & SP500. Presently, the tech sector appears to be the one with the strength and it probably will be the leader to take the market up if this bear market rally is to be continued.

For now, I will avoid the energy and the financials sector. I am also keeping clear away from the consumer discretionary and the consumer staples. The only sector I will focus on is the tech until the DJIA & SP500 have demonstrated they have regained some of the technical strength they have recently loss.


Share It

Wednesday, June 24, 2009

The Three Sectors

The three primary sectors that have led this bear market rally are: financial, energy, and technology. In order for this bear market rally to continue, these three sectors must resume its leadership. To get a perspective on how these sectors are performing, I will analyze their respective ETF, XLF for the financial, XLE for the energy, and XLK for the technology.

First up is the XLF, it has performed strongly since the March 2009 market low and the stress test was initiate on 19 major financial institutions. Recently, the strength from this sector have diminished and starting to roll away from the major moving averages and broken below the price channel support. Unless it can hold the April high and the May low support, and the 50 SMA along with the 20 EMA can reverse direction, this bear market rally for the financial will come to an end.


The energy was another sector that has shown tremendous strength during this bear market rally. As crude oil moved above the $70 a barrel, the energy sector begins to top out. Recently, the price action on the XLE has broken down and it looks very likely to be heading lower. Very doubtful this sector will provide the strength to keep this bear market rally going.


Finally, the tech sector appears to be catching its last breath. It is still hanging in the price channel and holding minor support. This sector along with some defensive sectors could provide strength to continue this bear market rally for a bit longer. It is this wild card that the market has not shown us the direction it will take.


Without the participation from any of these three sectors, this bear market rally cannot be sustained. As the 'green shoots' started to brown, and lack of evidence a recovery is around the corner, other sectors will also roll over and headed down.


Share It

Where Is This Heading

Now that option expiration has passed and the Fed meeting is over, we can finally get back to watch where the market is heading. In just a couple trading sessions, the market has given us a sense of change is in the work. This mean trading pattern will be different than the last month or so where it been moving more in a sideway pattern. If the market is heading down, expect the volatility to increase. Let see what the market is telling us.

From the DJI daily chart, it is still hanging inside the price channel. It has broken below the 20 EMA, 50 & 200 SMA. Unless it can move above the recent high near 8880 level before it breaks below the price channel, then this bear market rally has come to an end. (I have put up the 20 EMA to watch the short term trend, just another trend confirmation tool I use.)


The SP500 is also showing it is hanging inside its price channel. It has broken all three moving averages, similar to the DJI. If it breaks below the price channel, then 800 could be the next support level. To reaffirm the upward trend, it must move above the recent high near the 950 level.


In the tech heavy Nasdaq 100, it is trying to hold above the May's high. Unless it can move back into the price channel, it is very likely it will fall to the next support level near 1350.


As one can see from these market indices, the market is definitely at an inflection point where it can rally to newer high or it can reverse and go test the March 2009 low. I not am going to guess which direction the market will move. But I am preparing for the downside if it has decided to terminate this bear market rally. What I am expecting is within the next few trading sessions, the market will have decided where it is heading.


Share It

Monday, June 22, 2009

What Is Happening

What a way to start the week after the quadruple witching options expiration. The DJI finished off more than 200 points, the SP500 closed down more than 28 points, and the Nasdaq 100 loss almost 45 points. Advance/decline was in favor of the declines by more than 7:1 in the NYSE, and over 5:1 in the Nasdaq. The up/down volume was also in favor of the downside by over 14:1 in the NYSE and slightly under 9:1 in the Nasdaq. Based on these stats, the market was definitely being sold off today. There are people claiming this is simply profit taking to lock in Q2 profits, and others are saying this is the start of a correction.

Whatever the reason it might be, I am watching those key levels (see charts) to be breached before I draw any conclusion on the direction of the market. Until then, I will remain cautious and leaning more toward neutral. When it is unclear, the best position to take is no position. Trade cautiously until things are clear.


Share It

Sunday, June 21, 2009

The Coming Move

Now the quadruple witching options expiration is behind us, we should get a clearer picture on what the market might do. Next week is the last week of the quarter, and end of the quarter window dressing activities should occur.

Looking at the daily chart for the DJI, it shows the DJI consolidated above the 200 SMA near the 8750 level then the DJI dropped below the 200 SMA and tested the 8500 level. Now it appears to be getting ready to move back above the 200 SMA. Key resistance level to watch is the 8750, it needs to move above this level in order to maintain its upward trend toward the 9000 level. If DJI fails to move above and hold the 200 SMA for support, the 8250 support level could be in play and this could be a sign the DJI is about to turn over.


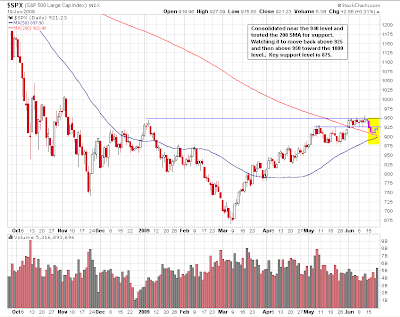
For the SP500, it has remained above the 200 SMA. It consolidated near the 940 level then retreated below the 925 level and tested the 200 SMA for support. It appears to be moving back up toward the 950. It is trying to clear the 925. The 50 SMA is also readying to cross over the 200 SMA. When it clears the 950 level, 1000 will be in sight.


The Nasdaq 100 came down and filled the early June gap and bounced off the May high. The strength in tech stocks continues to keep the Nasdaq 100 trending upward. First sign of caution will be if this index does not break above the 1510 level and retreats back below the 50 SMA.


I will continue to play on the side of strengths, which will be the tech. Being very selective on financial and transport. Avoiding energy as it is mixed and crude is extended. Also I will be reducing my position size until the major indices have move above the recent high. I will maintain a cautious bullish stance.


Share It

Sunday, June 14, 2009

Sectors Review

As the market is consolidating to get ready for its next move, I thought it would be a good opportunity for me to post my review on some of the market sectors. Before I proceed, I like to recommend all my readers to visit Dr. Brett's blog (it is also listed in my blogroll under TraderFeed,) he gives a good summary on the sectors performance and many valuable trading development techniques. In this post, I will cover those sectors that Dr. Brett has summarized.

The tech has been one of the leaders throughout this rally. The XLK has been trending higher and the 50 SMA has crossed over the 200 SMA. As the second quarter coming to an end, lot of those skeptical fund managers that have been underweight in tech will dress up their portfolio with tech stocks before the end of the quarter. This window dressing will boost the tech ETF, XLK higher.


The financial has been strong until its recent consolidation. Similar to the tech sector, lot of people were skeptical about the financial sector. For those skeptics that have missed this rally, they are feeling they must move in during this consolidation to make up for their miss. Also, for those fund managers that have been invested in financial, they will increase their position on financial to dress up their portfolio with recent strong performers. After the XLF consolidated near the 200 SMA, the end of the quarter window dressing will move it above the 200 SMA and continue its upward trend toward the Nov 2008 high level.


With crude oil going from the $30's to over $70 a barrel, the energy sector has benefited from the crude oil rally. Looking at the energy ETF, XLE, it appears there remains some additional upside. Although the crude oil rally might be near the end, but the momentum on the energy stocks will continue for a bit longer due to window dressing and the anticipated pick up in demands due to the summer months.


Until recent increases in the long bond yields and the mortgage rates, the consumer sectors were performing quite nicely in anticipating the recovery is just around the corner. As this bear market rally make its final move, the momentum should carry over to these consumer sectors for some additional upside. The strength of this upside will depends on the perceived action or inaction on the interest rate by the Fed to combat the rising bond yield.


Momentum for the materials ETF, XLB might be slowing a bit, but the uptrend remains intact.


The industrial sector is similar to the consumer sectors. It is consolidating above the 200 SMA for support. Until signs of technical deterioration, uptrend remains intact to break above the Jan 2009 high.


Finally, the health care sector is gaining strengths as money rotate into this sector.


Share It

Sunday, June 7, 2009

Here Come That Big Sucking Sound

Can you hear that big sucking sound coming from all those that have missed this rally and those that been waiting for the pullback rushing in? It's like a vacuum that will suck all these skeptics into this final leg of the bear market rally.

From the following weekly charts, one can see the next leg of this rally is developing. In my previous post, I have put out some possible measured moves to be monitored as this final leg is being play out. I will not be shorting this market here. Yes, the fundamentals are still bad. But this rally is purely based on technicals, just like the crude oil. As a trader, it doesn't matter what the trend is based upon. You just go with the trend and do not fight the tape.


Share It