Thursday, February 26, 2009

Another Reminder From The Dow Theory

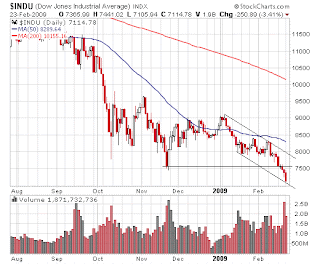
The DJT has been quite weak in the last couple trading sessions. Today, it hit another new low and this serve as a reminder to all market participants that a new low for the DJI is coming. The DJI attempted to rally back up to the 7500 level after it has broken the Nov. 20, 2008 low, but encountered strong resistance at the 7400 level. The SP500 also encountered resistance at the 780 level in this oversold rally and currently sitting near the Nov. 20, 2008 low. The Nasdaq 100 is sitting near the range bounded lower trendline. All these three indexes appear to be getting ready for the next down move.


Tomorrow is the last trading day for the month of February. Unless the DJT turns around while the DJI makes a new low, it will be another February that the market won't be making a bottom. Based on the breakdown in the big oils when the last new low was made, I expect these big oil companies such as XOM. CVX will continue to play a major role in taking the market lower. Depends on what Washington decide to do with the banks, the financial stocks will continue to be volatile until clarities and details for the plan are presented to the market.

March could be another disappointing month for those that are looking for a market bottom. Going back 30 years, I can only find two instances where the yearly low or a major low was made in the month of March. I will continue to monitor for trading opportunities on DXD, SDS, QID and GLD. I will shy away from the mining stocks or the mining stock ETF GDX. I will make a separate post this weekend on gold.


Share It

Monday, February 23, 2009

One Must Respect The Market

One must respect the market when it speaks. In the business of trading, it is not about being right or wrong on calling the market, it is about making money and preserving capitals. When the market tell you that your assessment is incorrect, you must respect it and adjust accordingly. Since last Thursday when the DJI closed at a new low without having many broader market indexes making new low, and without having many market breadth indicators dropping below their Nov. 20, 2008 level, the market was signaling it has formed an internal market bottom. Today, some of those broader market indexes such as the SP500 and the NYSE Composite made new low along with the DJI. Due to these new low, I have abandoned the cautious bullish stance I took since last Thursday and revert back to being bearish. Since the market has not send out a clear signal that it has bottomed, and with some broader market indexes falling back in sync with the DJI, I must respect the market and trade within its primary trend..DOWN, until it say otherwise.

Today the DJI made another confirmed low. This mean a lower low for the DJI is yet to come. Therefore, I will monitor DJI for trading opportunities on its ultra-short ETF DXD. As the market continue to head lower, gold will be the defacto safe haven for those that seek it. This will make gold continue its climb to above $1000 an ounce. I will continue to monitor gold for trading opportunities on its ETF, GLD. I will stay away from the QID and SDS, the ultra-short ETF for the Nasdaq 100 and SP500 respectively, until the market signals are clear to me the broader market and the Nasdaq are going lower. I would rather miss some trading opportunities than getting trapped.

Here's how the charts look after today.

The DJI closed today at 7114.78, which is below the 10/9/2002 closing low of 7286.27. The DJI today is only 723 point away from the 4/11/1997 closing low of 6391.69.


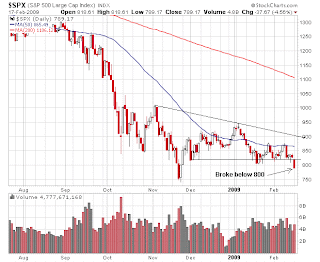
The SP500 broke the Nov. 20, 2008 low of 752.44 and closed at 743.33. It is only less than 6 points from the next closing low of 737.65 that was made on 4/11/1997. If the DJI reached the 4/11/1997 level, the SP500 will be much lower than 737.65.


The Nasdaq is still above its Nov. 20, 2008 of 1036.51. It closed at 1128.97 today, almost 100 points above its November 2008 closing low.


Share It

Sunday, February 22, 2009

I Was Not Surprised

To be honest, I just can't find anything new to add to this post that I have not said in my previous post. Although the DJI closed with another new low, I was not surprised. It closed with another confirmed low at 7365.67. This mean the DJI will see lower low. Once again, the broader market indexes did not closed with new low. In matter of fact, the Nasdaq 100 actually closed up. Furthermore, the price action from Friday's session for many indexes and stocks formed reversal candle patterns such as hammer, doji, and bullish engulfing. These patterns can be a sign that a rally is coming, or it can simply due to the pinning action caused by option expiration. But in either case, I won't be buying inverse ETF such as QID, SDS on this rally. I won't rule out buying DXD since the DJI will be making a lower low before this bear market ends based on the Dow Theory. Until the market tells me my current assessment is incorrect, I will continue to be cautiously bullish. If the broader market indexes fall back in sync with the DJI, then I will revert back to 100% bearish. Good trading to all of you and keep listening to what the market has to say when it make its new low.

Here are the updated charts.


Share It

Thursday, February 19, 2009

Good News, Bad News.

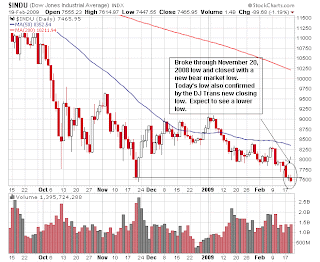
Today, the DJI finally closed with a new low that was forewarned repeatedly by the Dow Theory. The DJI closed today at 7465.95. The bad news is today's new low is another Dow Theory confirmed low and that mean the DJI will make a lower low. But it is not doomsday for the market like many believe it is. There is good news hidden in today's new low.

The good news is the broader market indices such as the SP500, NYSE Composite, the Nasdaq 100, and many others broader gauge of the equities market did not make a new closing low as they did back in November 20, 2008. Furthermore, many market breath indicators did not drop to their November 20, 2008 level. All these are signs that the internal market has bottomed. This does not mean the bear market has ended because the bull & bear market is based on the DJI, not on the broad market indices. Go back to a post I made last year to read what I have described will happen during a market bottoming process and you can see it being played out right now.

Today's new DJI closing low is a turning point for the market. It caused the market to go from totally bearish to cautiously bullish. This change in market sentiment will cause some smart money to start nibbling on those depressed value stocks. And for me, I too will start monitoring those stocks I consider as value stocks for buying opportunities to add them to my retirement account. My list will primary consist of companies that are the industry leaders in their respective market/business and that have consistently delivered solid past performance, and operate with a solid business model. As for my trading, I will start leaning toward making more long trades than short trades as the market make its transition from bearish to bullish.

Here is a caveat. If these broader market indices fall back in line with the DJI by making new low, then the market is back to the state as it was yesterday...bearish. Until the market say all coast are cleared, I will maintain a cautious bullish sentiment and trade with a small bullish bias.

Here are the updated charts for reference. There are good news and bad news to be read from them. They don't look as bad as they seem. The market is saying it is turning around. Pay close attention to the next DJI new low.


Share It

Wednesday, February 18, 2009

Another Moment In Gold

Gold broke above a major downtrend this month and moved from the low 900 range to nearly 990, a level when it was last seen in July of 2008. It has also broken above the upper trendline of the price channel formed after a small double bottom was made in November/December of 2008. From the gold continuous contract chart, one can see the price movement from the last few days appear to be going straight up. This steep price ascend indicating some speculation money are rushing in and it usually lead to a pullback due to profit taking from the early buyers.


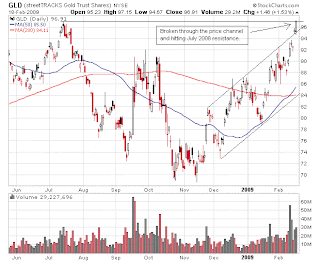
Similar price action can be seen from the gold ETF, GLD. The price have been moving up and hugging the upper channel trendline. It broke above the price channel yesterday and moved to the July 2008 high today. In the chart below, it shows the 50 SMA has crossed over the 200 SMA and both moving averages are trending up, and the price is safely above the 200 SMA. All these factors put the GLD (and gold) in a bullish trend.


Here is a weekly price chart for GLD. This chart give a wider view on the price movement of GLD. Again, both the 40 and 80 weeks moving average are up and price is above the two moving averages.


The Trade

Here is a review of my trade on GLD made in the current month:

My trading chart is set up with Fibonacci retracements using the high and the low in the previous month, which is January for this case. The solid white line is the 0% and 100% retracement, while the lines in between the two solid line are the intermediate 38%, 50% and 62% level. The dotted line outside the solid lines are the Fibonacci extension (click on the chart below for a larger view).


Going from left to right, the first red arrow is where an entry was made on 2/4/09 when the price broke above the trendline of the consolidation pullback pattern from previous 100% level. The initial stop loss is set to be on the other side of the 62% Fib level. The second red arrow is when addition was made to the initial position when the price broke through the 100% Fib level on 2/11/09. After the addition, the stop is moved up to the middle of the gap between the 2/11/09 and 2/10/09 bars (don't want to be holding the position while watching the gap being filled, and it also put the initial entry position in positive territory). The target is the Fibonacci extension, 138% level (second upper dotted line).

As the trade was enter, a pullback on 2/9/09 pushes the trade into negative territory but was still above the stop loss level, so nothing was done. On 2/13/09, there was a doji hammer tested the 100% Fib level for support. Then the next day, a big gap up on the open and the price moved to the trendline and start showing some resistance. Although the target is still a little distance away, partial profit was taken when the price started to pullback from the trendline (first green arrow). After taken partial profit, the stop loss is moved to breakeven level. In this case, I use the entry price of the add-on position as the breakeven price, this will prevent from returning profits that have already been taken. Profit on the remaining position was taken (second green arrow) when the price moved below yesterday candle's body while waiting for it to reach the FE target. Shortly after the trade was closed, gold started to move up again and the GLD moved above the Fib extension profit target (can't win them all).


Share It

Tuesday, February 17, 2009

How Significant Is 0.31

In my previous post, I have pointed out some of the key levels on the DJI, SP500 and Nasdaq 100 to be monitored, and to aware of the possibility for these indices to test their November 20, 2008 low once these levels are broken. Today, the DJIA did exactly that, it broke below the range bound lower support and went down to test the November 2008 low.


The SP500 also broke its support, but it did not drop down to test its November 2008 low.


Likewise for the Nasdaq 100, it gapped beneath the 50 SMA support and dived down to the 1190-1200 level to test for support.


At the end of the trading session, the DJI closed 0.31 point above the November 2008 low. For a brief moment before the DJI was settled, it actually printed the exact closing number as November 20, 2008, 7552.29. So how significant is the 0.31 point away from the previous closing low?

If you are a true market watcher and a bull, this 0.31 is very significant. You would have wished the DJI had closed 0.31 point lower to closed at the previous closing low or closed with a new low today. Although this DJI new low would have been a confirmed low by the DJT new closing low made today, but it would have represented a turning point for the market. For you true market watchers, you'll know what I'm talking about. For those that do not know what I'm referring to, I will elaborate when the DJI actually closed with a new low on a day similar to today (not to miss the post when it occurs, I highly recommend that you subscribe to this blog either via email or RSS reader and you will be notified whenever I make a new post).

To see what is the likelihood for the DJI to bottom in the month of February, I went and check the daily close from 1970 to 2008 and found only once the DJI made a market bottom low in February. On February 28, 1978, the DJI closed at 742.12 to put in a bottom for the bear market started in 1976. Not to say it is not probable to see the DJI bottomed in February, the odd for it to do it is quite low. Does it mean we won't see a lower low until after February? Absolute not. It only mean if any new low to occur in February, the odd is there will be lower low to come before the market bottomed. But lets not get ahead of ourself by speculating what the market might or might not do. Like any good student of the market, I will continue to pay attention and listen to what the market has to say and act accordingly. For now, it is saying it will go lower.

Gold have been making a move since my last post on it. I will put up a new post on gold soon.


Share It

Monday, February 16, 2009

Rollercoaster Ride

Last week the market was put in a state of great anticipation on what might be a plan to bailout the banks, then it was greatly disappointed by the lack of details from the announcement by the Sec. of Treasury. If that wasn't enough, there was the stimulus bill that was being pushed through congress in the same manner as the TARP I. From these DC gyrations, the market had a mini rollercoaster ride.

Looking at the charts for the DJI, SP500 and Nasdaq 100, it appears the DJI and the SP500 are most vulnerable to break support and head toward the November 2008 low. The Nasdaq 100 show a bit of strength riding above the 50 SMA. But the earning report from HPQ coming out in mid-week can tilt the tech heavy Nasdaq 100 back in sync with the DJI and SP500. Here are the charts, click on it to view the comments.


Share It

Thursday, February 12, 2009

Fibonacci Rule

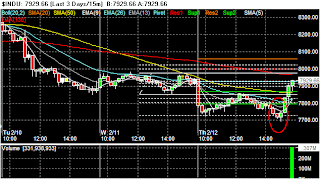
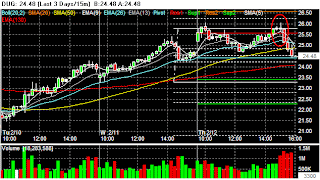
Today was another one of those last hour reversal day. Just an hour or so before the end of the trading session, the market started to reverse from a deficit of more than 200 points to closed nearly unchanged. What was striking is how and where the market started to turn around. You can call it coincidence, collution, natural behavior, or whatever you like. Take a look at the following charts where I have circled the spot where the market started to reverse. All of them reversed near or at a Fibonacci retracement level. I can see how some of the indices reverse at similar time, but at the same inflection point? If you are not watching Fibonacci retracement levels, you might want to consider it after you have reviewed these charts. As usual, click on the chart to get a larger image. The solid white line is the 0% & 100% Fibonacci level while the dotted lines are intermediate levels.


Share It

Tuesday, February 10, 2009

The Great Experiment

The Secretary of Treasury finally revealed the highly anticipated TARP II bank bailout plan today. The Secretary said the new plan can cost up to $2T and will consist of many things, some of them will work and some of them might not. Obviously the market was very disappointed with the announcement because it lacked details, and it sounded like a great experiment of lets try different things and see what stick. With no great surprise, the financial stocks were sold off and the Dow dropped more than 380 points.

Last week in one of my post, I have allured a possible long trade for GS and MS. Today, that long trade came to an end. The following charts highlight the setup and exit I was monitoring for the trade on GS.


(click on the image to get a larger view)

In the GS daily chart, I use the January's high and low to establish the Fibonacci retracement levels for February trading. GS started to pullback near the end of January until the first bar (white arrow) in February, where it tested for support at the 62% Fib retracement. The 2nd candle in February, a hammer candle again tested the 62% retracement for support and presented the setup. A long position was triggered when the next candle (3rd bar in February) exceeded the high of the hammer candle (circled in red). The initial target is the 100% retracement level (red arrow) and the extended target will be the Fib Extension, 138% (FE, the most upper dotted line), while the low of the hammer will be used for establishing the stop loss level. On the 4th bar in Feb, it reached the initial target. Since this target is some distance away from the upper trendline, one could take a partial profit instead of exiting the position completely and leave a portion of the position to see if it can run up to the trendline. If it break through the trendline, then monitor it for possible move to the FE (138%) level. On Monday, the day before the TARP II announcement, a hangman candle was formed near the upper trendline. As the price started to retreat today and when it dropped below the lower body of the hangman, the position is closed. If one want to hang on for confirmation, then the position must be exited when the price dropped below the low of the hangman or risk in turning a profitable trade into a losing trade (circled yellow).


(click on the image to get a larger view)

In the 15 minutes intraday chart, an evening star reversal pattern was formed from the first 45 minutes of trading today (circled in red). This is a sign to get out, and when the price broke through the retracement zone, one shouldn't even have any second thought on closing out the position.

Until more details are presented for the TARP II, the financial stocks will most likely continue to be volatile. I will continue to monitor them for new trading opportunities.


Share It

Sunday, February 8, 2009

On Our Way To 2,000,000,000,000

No, the 2 trillion (2,000,000,000,000) is not my forecast for the Dow...haha! This is how much we could ended up adding to our national debt next week after the $780B stimulus package passed congress, and our treasury's TARP II bank bailout plan revealed.

The word is an additional $1 trillion is likely to be requested for the TARP II on top of the remaining $300B left from TARP I. If that is true, the bank bailout combined with the $780B stimulus package will bring the total in the range of $2T (so its not exactly $2T, what is a few tens of billion dollars here and there in comparison to the total amount we end up spending..sarcasm). We should start conditioning ourself to look at the T for trillion instead of all those zeros, because we will see the trillion more and more in the near future. And I'm sure the politicians would prefer it this way, it is less shocking to the public when they don't see all those zeros. After all, for each change in the letter, it is a thousand times more of the previous letter value (sorry if I have shocked you).

So, since we already know the lawmakers in DC really don't care what you or I think of all this, and they will do whatever they want to do. Rightfully or wrongfully, the tone in DC is that the debate is over and its time to do something.

What will this massive amount added to our national debt will do? Inflation is one sure thing it will create for our future. Looking at the 20+ years treasury bond fund ETF, TLT, you will see it has been falling since the beginning of the year.
Granted, the initial run up on this ETF is flight to quality. But now money is exiting in anticipation of higher inflation to come due to all these extra liquidity the world's central banks and governments are injecting into the global financial system. On the inverse, you will see money is moving into the TBT, an ETF that bet the rate on the long term treasury bond will go up (the price of the long term treasury bond will go down).

Then you look at the TIP, an ETF of the Barclay (formerly Lehman) TIPS bond fund is getting set to move higher. The TIPS is a treasury bond with principal adjusted for inflation. As inflation increase so does the principal and vice versa.


All these ETFs are telling us we are no longer worry about deflation (as we were back in October/November 2008), instead, our concern is on inflation. If I'm planning to hedge against inflation, I would be putting some money on TIPS and on gold by buying their respective ETF, TIP & GLD.


Share It

Thursday, February 5, 2009

The Survivors Of Wall St.

During the last couple weeks, Bank of America (BAC) was the headliner whenever the banking stocks get clobbered. Today for the first time, BAC went below $4.00 before it rebounded.
And AIG is coming back for more bailout after it has received $150B government aids. Citigroup is also not getting any better after receiving $50B bailout. With these insitutions in such a dire state, you would think the price of all the financial stocks are going to zero. Look closely, you'll be surprise.

Although Wall St. will never be the same after Bear Stearns being melted into JP Morgan, BAC got stuck with Merrill Lynch, and Lehman Brothers went bankrupted. But the last two Investment Banks on Wall Street (oops, they call themselves Bank Holdings Company now), Goldman Sachs (GS) and Morgan Stanley (MS) are the survivors of Wall St. Their stock prices are far from zero.

To the contrary, they are trending up. The stock of these two survivors of Wall Street seem to be turning around. Could this turn around in their stock prices a temporary one or are things in the financial market starting to turn for the better, or maybe simply the worst have been seen. For whatever reasons, it appears GS & MS have survived the turmoil of Wall St. GS is saying it wants to pay the government back the TARP money it has received soon. MS said it didn't need the TARP money when it was forced to take it then and it doesn't need the TARP money now.

Not sure if it is time to invest in GS & MS, but definitely they have presented a trading opportunity. Keep you eyes open. If the market is near bottoming, there are many more opportunities like GS & MS.


Share It

Tuesday, February 3, 2009

Was There Any Doubt?

I was kind of amused by the article "Was that a Dow Theory sell signal?" appeared in MarketWatch on Monday. What made me amused is not the contents but the title of the article. The title implies we were in a bull market until Monday, February 2, 2009, when we got a Dow Theory sell signal that put us in a new bear market.

For those that have been following this blog know I have repeatedly stated we are still in a bear market and the bottom has not been made. In my post on October 25, 2008, "The Market Whispered", I wrote about how the Dow Theory told us a lower low is yet to come. Again on October 27, 2008, the Dow Theory reiterate a lower low is yet to come. The day before the November 20, 2008 low, another Dow Theory confirmed low telling us a new low is forth coming. Finally, the November 20th low. Is there still doubt that we are not in a bear market. With Monday February 2, 2009 Dow Transport new low, the Dow Theory is telling us again to expect a new low on the DJIA.


I maintain the belief we are still in a bear market until the DJIA makes a non-confirmed low. And I would have titled the MarketWatch article "Was there any doubt we are still in a bear market?"


Share It

Sunday, February 1, 2009

The Golden Moment

On January 24, 2009, I put up a post saying "Here comes the gold." On the following Monday, a spike in GLD (the gold ETF) price occurred and indicated there was increased new interest in gold from the sideline (click on the chart on the left for a larger image). Those that got in at the low 80s level were waiting for this golden moment to take some profits. As the price retreated back to the breakout level, those that missed getting on board saw it as a second chance for them to get in. Now gold has caught the attention of many in the financial press, more sideline money will be coming in to help push it above the $1000 level, and the ETF GLD will likely break the July, 2008 resistance level.


While gold was up more than $20 last Friday, the gold mining stocks retreated from their opening high and ended the session by giving up some of the recent gains. This warrant some careful monitoring to make sure the divergence between the gold mining stocks and the precious metal itself does not continue for too long.

It can be that people are just more incline to own the actual gold than the gold mining companies. If this turn out to be the case, then the run for the hill on gold will be very sharp and quick. From the ABX chart, one can see how the price retreated on Friday from its opening high (big solid weak candle).

For those that are interested in gold mining stocks, an alternative to picking gold mining companies is to play the ETF GDX. This is an ETF that track a group of mining companies.


I hope you will have your golden moment from the bull move on gold. Trade well, trade profitably, and don't get greedy.


Share It