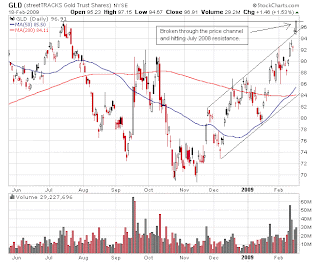
Similar price action can be seen from the gold ETF, GLD. The price have been moving up and hugging the upper channel trendline. It broke above the price channel yesterday and moved to the July 2008 high today. In the chart below, it shows the 50 SMA has crossed over the 200 SMA and both moving averages are trending up, and the price is safely above the 200 SMA. All these factors put the GLD (and gold) in a bullish trend.

Here is a weekly price chart for GLD. This chart give a wider view on the price movement of GLD. Again, both the 40 and 80 weeks moving average are up and price is above the two moving averages.

The Trade
Here is a review of my trade on GLD made in the current month:
My trading chart is set up with Fibonacci retracements using the high and the low in the previous month, which is January for this case. The solid white line is the 0% and 100% retracement, while the lines in between the two solid line are the intermediate 38%, 50% and 62% level. The dotted line outside the solid lines are the Fibonacci extension (click on the chart below for a larger view).

Going from left to right, the first red arrow is where an entry was made on 2/4/09 when the price broke above the trendline of the consolidation pullback pattern from previous 100% level. The initial stop loss is set to be on the other side of the 62% Fib level. The second red arrow is when addition was made to the initial position when the price broke through the 100% Fib level on 2/11/09. After the addition, the stop is moved up to the middle of the gap between the 2/11/09 and 2/10/09 bars (don't want to be holding the position while watching the gap being filled, and it also put the initial entry position in positive territory). The target is the Fibonacci extension, 138% level (second upper dotted line).
As the trade was enter, a pullback on 2/9/09 pushes the trade into negative territory but was still above the stop loss level, so nothing was done. On 2/13/09, there was a doji hammer tested the 100% Fib level for support. Then the next day, a big gap up on the open and the price moved to the trendline and start showing some resistance. Although the target is still a little distance away, partial profit was taken when the price started to pullback from the trendline (first green arrow). After taken partial profit, the stop loss is moved to breakeven level. In this case, I use the entry price of the add-on position as the breakeven price, this will prevent from returning profits that have already been taken. Profit on the remaining position was taken (second green arrow) when the price moved below yesterday candle's body while waiting for it to reach the FE target. Shortly after the trade was closed, gold started to move up again and the GLD moved above the Fib extension profit target (can't win them all).