Sunday, January 30, 2011

Things Got Dicey

Things got a bit dicey last Friday. I was expecting an interesting Friday after AMZN was hammered in the after hour trading on Thursday. When the market is extended and so many traders are just looking for an excuse to sell, it doesn’t take much. After the SP500 pushed above 1300 with a negative advance/decline along with the uncertainty from the uprising in Egypt, the traders found that to be enough reason to sell. Is this sell off the beginning of a correction?

The SP500 still appears it will close above 1300 and the DJIA is destining to move beyond 12,000. Until the SP500 close above the 1300 and the DJIA move pass 12,000 decisively or the SP500 to break below 1262, I will remain cautiously bullish. I would categorize Friday’s sell off as a pull back and I will keep a close watch on some of those stocks that were hit hard during the last couple trading sessions to bounce off their intermediate support.

SP500:


DJIA:


Nasdaq 100:


With food prices rising, the agriculture sector could be an interesting play. Here is the price chart for MOO showing how it is bouncing off its support trend line:


And one of the fertilizer stock Agrium, AGU behaving similarly as the MOO ETF:


Share It

Saturday, January 22, 2011

Week Of Volatilities

OpEx week, start of quarterly earnings report, and an extended market, a perfect combination for a week of volatile price actions. Toss in some news about Steve Job’s medical leave and some disappointed earnings report from some high flyers, and you have the Nasdaq 100 taking a dive.

Is this the beginning of the correction that so many traders have been waiting for? Or is this just a shake out from the typical OpEx week activities? In regardless what it turns out to be, the important thing to pay attention to is the price action. Definitely some high flying stocks in the cloud space and in the rare earth sector have came back down to earth (pun intended). Some of the market leaders in the tech sector also have retreated.

Although there was some damage done to the market indices from the recent pull back, but the damage is not enough to change the current trend. That does not mean there is no headwind that can cause the current trend to be changed. The SP500 is trying to hold support near the 1278 level, the Nasdaq 100 could drop down to test the 2250 level if it fails to hold on to its 20 EMA support, and the Russell 2000 has broken below its 20 EMA and is coming down to test the 50 SMA for support.

SP500:


Nasdaq 100:


Russell 2000:


DJIA:


Until the market has tested and held its support level, I will continue to be cautious and I will not rush to open new positions (long and short).


Share It

Saturday, January 15, 2011

It Will Not Be Denied

The SP500 is telling us that it will not be denied from reaching 1300. Although it is extended, but it doesn’t mean it will falter and give up on reaching its target. As the number of market participants calling the market top increases, the less likely the market will topple. The Nasdaq broken out and entered the level that hasn’t been seen since 2001. The Russell 2000 appears to be making a run toward 850, and the DJIA is marching toward the 12000 level. Shorting the market here is foolish. Being completely bullish is being negligent. I will continue to be cautiously bullish and take whatever the market gives me. There are so many opportunities that one does not need to hold on to a trade longer than necessary. Any missed potential profits can be made up from other trade opportunities. In this extended market, the longer one holds the position, the greater the risk of being chopped on a sudden reversal.

Here are the updated charts. Click on them to get a larger view and to read the commentary.

SP500:


Nasdaq 100:


DJIA:


Russell 2000:


TBF:


UUP:


MOO:


Share It

Monday, January 10, 2011

False Sense of Bullishness

Check out the 5 minutes intraday chart for the SP500. I mentioned in the Saturday post to keep an eye on the 1262 support level. Look what it did around 10:00am today!


The daily price chart shows a hammer inside bar pattern flirting with the 1262 level while the MACD continue to show divergence. I will continue to be cautiously bullish and not to fall into the trap of ‘false sense of bullishness‘.


Share It

RIMM - (Exit 1/10/11)

Today the market opened with a negative tone. RIMM gapped down on the open and triggered the protective stop of $60.93. In the afternoon around 1:00 pm, it started its move to fill the opening gap and ended the day with a small gain and testing the $62 level once again.

This swing long trade closed with a 0.71R profit.

Below is the 5 minutes intraday chart showing where the protective stop was and when it was hit.

Intraday:


RIMM technically still positive, but no need to chase it. I will continue to monitor for the next long setup above the $62 level or near the $59 support region.

Daily:


Share It

Saturday, January 8, 2011

First Week of 2011

The first week of trading for 2011 is over and the market’s appearance is it is going higher. But internally, there are signs that said in the short term it might come back down a bit before it resume its move to higher high.

The SP500 is climbing toward the 1300 level but the divergence with the MACD could put this climb on a temporary halt.

SP500:


Similar divergence appeared on the DJIA and Nasdaq 100.

DJIA:


Nasdaq 100:


This divergence does not imply a pullback will occur, it just put out signs that momentum is slowing and a possible pull back could happen. Whenever I see this type of divergence, I move into a cautionary mode and be less aggressive on the long side.

The UUP (US dollars ETF) showed some strength and broke out of a small declining price channel. The level I am watching is the high of 23.52 it made on 11/30/2010 and the 200 SMA. I will continue to consider the trend to be down until it has broken above these levels and formed a higher high/higher low pattern.

UUP:


The short US long term treasury ETF, TBF is hovering in the middle of a rising price channel and bumping up against a possible baseline resistance at 45.42. If it breaks above this level, potential upside could be the upper price channel trend line near 47.

TBF:


The Agri ETF, MOO continues its upward trend with upper target level near 58.

MOO:


Share It

RIMM - 1/6/2011 Update Notice

For those email subscribers that did not get the RIMM 1/6/2011 update post delivery, here is the link for the post.

RIMM 1/6/2011 update.


Share It

Thursday, January 6, 2011

RIMM – (Updated 1/6/2011)

1/6/2011 Updates:

The trade was not stopped out today. If the breakeven stop was placed at the trigger level of $59.86 after a partial profit was taken near $62 yesterday, then today’s intraday low of $59.80 would have triggered the stop and closed out this trade. Today’s price action illustrates the importance on avoid placing stop near obvious support or resistance levels.

Today’s price action also setup a baseline near $62 for it to break in order to have a chance on reaching the 2nd target level of $64 and possibly breaking the downtrend.

Here is today’s intraday 5 minutes chart highlighting some key levels:


1/5/2011:

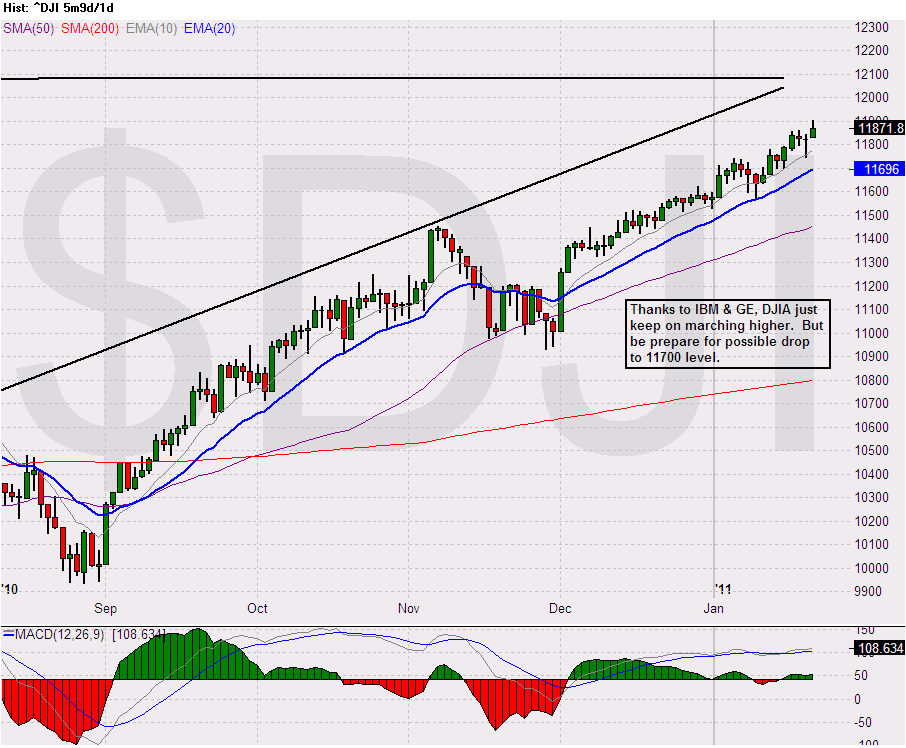
Three trading days into a brand new year and the market has already reminded us who is in charge. In the first trading session of 2011, stocks opened with a bang and reached their resistance level (target level) in one big opening move, then in the second trading session similar strength was demonstrated on the opening but this time stock prices faded and ended up giving back most if not all the previous day’s gain. Finally, today the market reverted to its ascend and closed with a gain. Here is the latest SP500 chart. Target level remains to be near 1300.

SP500:


Throughout 2011, I will post some of my trades and my trade analysis to help me improve my trading discipline. By posting some of my trades in public, I hope it will subconsciously make me trade little more defensively with better discretions.

Here is my first trading post for this year. RIMM was one of the stocks in my ‘swing long triggered’ list today. From the following weekly price chart, RIMM has been trending downward since the middle of 2009 to the present. It has been trading methodologically within the declining price channel.

RIMM - weekly:


Recently, after it hit the resistance from upper channel trend line, the retracement back to the lower channel trend line present a swing long trade opportunity similar to the one in April of 2010. As the confluence of different rising moving average converge toward a price level, it sets up a swing long trade. In this case, the trigger from the daily price chart is the high of the candle prior to the setup candle ($59.86), and the stop loss is somewhere between the setup candle’s low and slightly below $58 (I never set my stops at the whole number levels since these levels are like magnet and they will likely be hit.) The targets are 62 & 64.

RIMM - daily:


From the 5 minutes intraday chart, it shows RIMM spent more than three hours trading near the R1 pivot level of 59.63. As the last hour of trading approaches, RIMM broke above the $59.90 baseline level with increasing volume and it reached the $62 target level prior to the closing bell. As it hit the $62 target level, took profits on 1/2 of the position with a slightly more than +1R and move the stop to breakeven for the remaining 1/2 of the position to setup a risk free trade for the remaining position.

RIMM - 5 minutes intrady:


With the surging volume and having the price close near the upper trend line, there is a high probability RIMM will breakout from the price channel and reach the 2nd target level of $64. I will post updates as this trade progresses.


Share It

Saturday, January 1, 2011

Happy New Year!

As we enter the New Year, I am sensing an increase of optimism. This increase of optimism is not because we have solved and righted all the economic & financial ills in the US and around the world. The US still have an unemployment rate close to 10%, huge federal budget deficit, a housing market still seeking a bottom, and many states are in a brink of default. But for whatever the reason(s), people are beginning to feel a bit more positive about the future, and that is a good thing for the future of the economy…especially a consumption economy such as the U.S.

In the beginning of 2010, I mentioned one of the things I will be watching is the US dollars, and as the Euro Zone exposed their financial problems, the US dollars strengthen. When helicopter Ben start contemplating his academic experiment of dropping money out of the sky with his QE2, the US dollars retreated. The UUP chart below shows how the US dollars ended near where it started in 2010 after it has peaked in June.

UUP:


What will I be watching in 2011? Bond! I believe the QE2 is the needle that will pop the bond market bubble. It doesn’t matter if the US decides to reduce its budget deficit, it still have to finance its debt. The arrogance of the Fed to simply print money ($600B) without any regards to those that are holding the US dollars will cause those that been financing the US debt to stop buying the US bonds. This action will force the interest rate to go up and will lead to another economic crisis down the road. One way to profit from this scenario in the market is by trading the short 20+ year treasury ETF, TBF. As US interest rates rise, bond prices will decrease and the price of TBF will increase.

TBF:


Another consequence of a devalued US dollar and rising interest rate is inflation. As inflation starts to creep up, commodities price increases will accelerate. In 2011, I will also be watching for opportunities to trade the agriculture ETF, MOO.

MOO:


While the SP500 broke through the 1250 level, it hasn’t shown any signs of topping out. although it does appear to be extended on the upside, a minor pullback when everyone are back next week will not be a big surprise to me. I’m still looking for higher high from the SP500.

SP500:


Share It