In this weekly stock market update and analysis, we will review the stock market internals and the SP500 to see if the market has bottomed and where it might be headed in the near term. We will also analyze the US dollar, gold, and oil. Finally, we will review the FAANG stocks to see how they are holding up.
Showing posts with label UUP. Show all posts
Showing posts with label UUP. Show all posts
Sunday, March 22, 2020
Tuesday, October 6, 2015
Market Recap & Stock Update - 10/6/2015
A recap of today's market & the following momo stocks: AAPL FB AMZN NFLX GOOGL TWTR TSLA IBB TLT UUP.
Share It
Tweet
Sunday, October 4, 2015
Weekly Market Recap & Stock Update - 10/4/2015
A review of the market & momo stocks: AAPL FB AMZN NFLX GOOGL TWTR TSLA IBB TLT UUP DX_F.
Share It
Tweet
Wednesday, September 30, 2015
Market Recap & Stock Update - 9/30/2015
In this video, we will review the market and the following momo stocks: AAPL, FB, AMZN, NFLX, GOOGL, TWTR, TSLA and ETFs; TLT, UUP, IBB.
Share It
Tweet
Sunday, March 8, 2015
Stocks Review - 3/8/2015
In this video, we will review the stocks I have posted on Twitter last week. The stocks are: FB GOOGL VRTX ARWR WB REGN SLB LLY INTC ORCL LUV IBM GILD /CL TLT UUP TWTR ICPT MEET CYBR AMZN MXIM T NKE GS HPQ GMCR & BX.
Share It
Tweet
Sunday, July 29, 2012
Another Round Of QE Is Coming?
The market is appear to be pricing in some kind of easing from the Central Banks. Here is a look at some of the sectors that can help move the market higher.
Click on the title if you do not see a video player on your screen to view the video.
Click on the title if you do not see a video player on your screen to view the video.
Share It
Tweet
Sunday, June 3, 2012
Market Review - 6/3/2012
Here are couple video posted this weekend reviewing the market indices and some of the factors that will likely keep the downward pressure on the equities market.
Share It
Tweet
Sunday, April 10, 2011
Things To Watch
Until the end of QE2, the market will continue to move higher. Although the recent price actions showing the market is stalling (potential pull back), but the trend remain to be up. The things to watch as the market make its next move to higher level are the continuation of rising commodities prices due to weakening US dollar. And for the market to mount a rally with conviction, the financial and the tech sector will need to participate.
The ETFs to watch are MOO (commodities), GLD (gold), TBF (short US Treasury), UUP (US dollar), XLF (financial), and SMH (semiconductor). The weekly price chart for XLF show it is forming a cup and handle price pattern, while the weekly price chart for the semiconductor sector ETF, SMH show it is working on its weekly bull flag move.
GLD (gold):

MOO (commodities):

UUP (US dollar):

TBF (20+ yrs US Treas. Short):

XLF (financial):

SMH (semiconductor):

Share It
Tweet
Saturday, January 15, 2011
It Will Not Be Denied
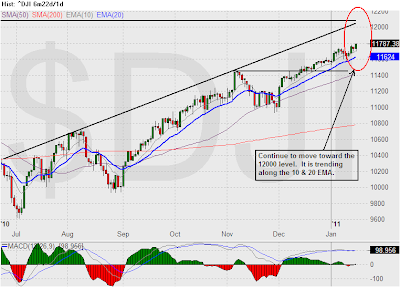
The SP500 is telling us that it will not be denied from reaching 1300. Although it is extended, but it doesn’t mean it will falter and give up on reaching its target. As the number of market participants calling the market top increases, the less likely the market will topple. The Nasdaq broken out and entered the level that hasn’t been seen since 2001. The Russell 2000 appears to be making a run toward 850, and the DJIA is marching toward the 12000 level. Shorting the market here is foolish. Being completely bullish is being negligent. I will continue to be cautiously bullish and take whatever the market gives me. There are so many opportunities that one does not need to hold on to a trade longer than necessary. Any missed potential profits can be made up from other trade opportunities. In this extended market, the longer one holds the position, the greater the risk of being chopped on a sudden reversal.
Here are the updated charts. Click on them to get a larger view and to read the commentary.
SP500:

Nasdaq 100:

DJIA:
Russell 2000:

TBF:

UUP:

MOO:

Here are the updated charts. Click on them to get a larger view and to read the commentary.
SP500:

Nasdaq 100:

DJIA:

Russell 2000:

TBF:

UUP:

MOO:

Share It
Tweet
Saturday, January 8, 2011
First Week of 2011
The first week of trading for 2011 is over and the market’s appearance is it is going higher. But internally, there are signs that said in the short term it might come back down a bit before it resume its move to higher high.
The SP500 is climbing toward the 1300 level but the divergence with the MACD could put this climb on a temporary halt.
SP500:

Similar divergence appeared on the DJIA and Nasdaq 100.
DJIA:

Nasdaq 100:

This divergence does not imply a pullback will occur, it just put out signs that momentum is slowing and a possible pull back could happen. Whenever I see this type of divergence, I move into a cautionary mode and be less aggressive on the long side.
The UUP (US dollars ETF) showed some strength and broke out of a small declining price channel. The level I am watching is the high of 23.52 it made on 11/30/2010 and the 200 SMA. I will continue to consider the trend to be down until it has broken above these levels and formed a higher high/higher low pattern.
UUP:

The short US long term treasury ETF, TBF is hovering in the middle of a rising price channel and bumping up against a possible baseline resistance at 45.42. If it breaks above this level, potential upside could be the upper price channel trend line near 47.
TBF:

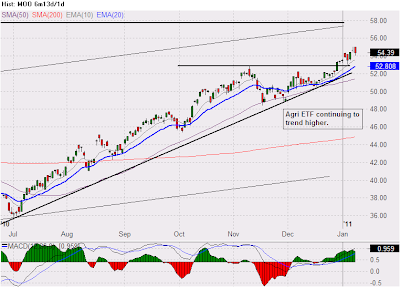
The Agri ETF, MOO continues its upward trend with upper target level near 58.
MOO:
The SP500 is climbing toward the 1300 level but the divergence with the MACD could put this climb on a temporary halt.
SP500:

Similar divergence appeared on the DJIA and Nasdaq 100.
DJIA:

Nasdaq 100:

This divergence does not imply a pullback will occur, it just put out signs that momentum is slowing and a possible pull back could happen. Whenever I see this type of divergence, I move into a cautionary mode and be less aggressive on the long side.
The UUP (US dollars ETF) showed some strength and broke out of a small declining price channel. The level I am watching is the high of 23.52 it made on 11/30/2010 and the 200 SMA. I will continue to consider the trend to be down until it has broken above these levels and formed a higher high/higher low pattern.
UUP:

The short US long term treasury ETF, TBF is hovering in the middle of a rising price channel and bumping up against a possible baseline resistance at 45.42. If it breaks above this level, potential upside could be the upper price channel trend line near 47.
TBF:

The Agri ETF, MOO continues its upward trend with upper target level near 58.
MOO:

Share It
Tweet
Saturday, January 1, 2011
Happy New Year!
As we enter the New Year, I am sensing an increase of optimism. This increase of optimism is not because we have solved and righted all the economic & financial ills in the US and around the world. The US still have an unemployment rate close to 10%, huge federal budget deficit, a housing market still seeking a bottom, and many states are in a brink of default. But for whatever the reason(s), people are beginning to feel a bit more positive about the future, and that is a good thing for the future of the economy…especially a consumption economy such as the U.S.
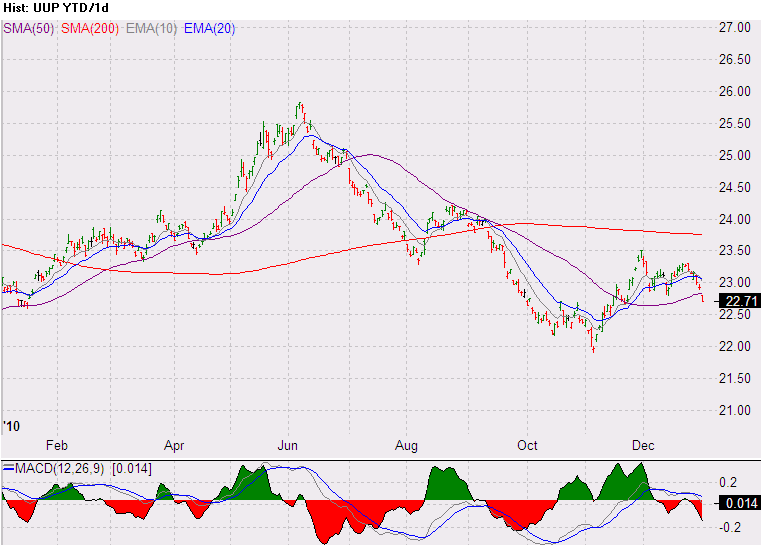
In the beginning of 2010, I mentioned one of the things I will be watching is the US dollars, and as the Euro Zone exposed their financial problems, the US dollars strengthen. When helicopter Ben start contemplating his academic experiment of dropping money out of the sky with his QE2, the US dollars retreated. The UUP chart below shows how the US dollars ended near where it started in 2010 after it has peaked in June.
UUP:

What will I be watching in 2011? Bond! I believe the QE2 is the needle that will pop the bond market bubble. It doesn’t matter if the US decides to reduce its budget deficit, it still have to finance its debt. The arrogance of the Fed to simply print money ($600B) without any regards to those that are holding the US dollars will cause those that been financing the US debt to stop buying the US bonds. This action will force the interest rate to go up and will lead to another economic crisis down the road. One way to profit from this scenario in the market is by trading the short 20+ year treasury ETF, TBF. As US interest rates rise, bond prices will decrease and the price of TBF will increase.
TBF:

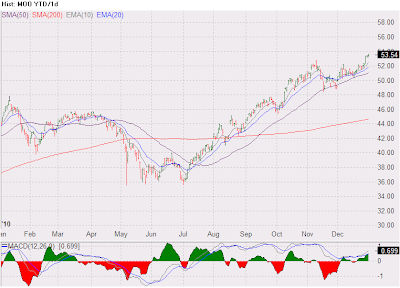
Another consequence of a devalued US dollar and rising interest rate is inflation. As inflation starts to creep up, commodities price increases will accelerate. In 2011, I will also be watching for opportunities to trade the agriculture ETF, MOO.
MOO:
While the SP500 broke through the 1250 level, it hasn’t shown any signs of topping out. although it does appear to be extended on the upside, a minor pullback when everyone are back next week will not be a big surprise to me. I’m still looking for higher high from the SP500.
SP500:

In the beginning of 2010, I mentioned one of the things I will be watching is the US dollars, and as the Euro Zone exposed their financial problems, the US dollars strengthen. When helicopter Ben start contemplating his academic experiment of dropping money out of the sky with his QE2, the US dollars retreated. The UUP chart below shows how the US dollars ended near where it started in 2010 after it has peaked in June.
UUP:
What will I be watching in 2011? Bond! I believe the QE2 is the needle that will pop the bond market bubble. It doesn’t matter if the US decides to reduce its budget deficit, it still have to finance its debt. The arrogance of the Fed to simply print money ($600B) without any regards to those that are holding the US dollars will cause those that been financing the US debt to stop buying the US bonds. This action will force the interest rate to go up and will lead to another economic crisis down the road. One way to profit from this scenario in the market is by trading the short 20+ year treasury ETF, TBF. As US interest rates rise, bond prices will decrease and the price of TBF will increase.
TBF:

Another consequence of a devalued US dollar and rising interest rate is inflation. As inflation starts to creep up, commodities price increases will accelerate. In 2011, I will also be watching for opportunities to trade the agriculture ETF, MOO.
MOO:

While the SP500 broke through the 1250 level, it hasn’t shown any signs of topping out. although it does appear to be extended on the upside, a minor pullback when everyone are back next week will not be a big surprise to me. I’m still looking for higher high from the SP500.
SP500:

Share It
Tweet
Sunday, January 10, 2010
Happy New Year!
The first week of trading in 2010 was quite interesting with all those data watchers (the media talking heads) focused on the job report. A big deal was made on the widely anticipated positive job report last Friday, and it turns out to be a loss of 85,000 jobs. Based on the market’s reaction, it didn’t turn out to be such a big event as the talking heads made it to be. The market just keeps on crawling higher. The SP500 finally hit the measured move of the bull flag formed back in July 2009. The market appears to continue its bullish stance with sector rotation to provide the needed leadership. During the period in November and December 2009, the financial sector was weak. And at the end of the year, the financial started to show sign of reversing, and the first week of 2010, the financial was one of the strong sectors along with the energy sector that provided the catalyst for the first week's gains.
Here is an updated chart for the SP500:

As the economy struggle along, 2010 will be a year for dollar watching. Here is the chart for the dollar index, DXY, the ETF on the dollar/Euro, FXE, and the dollar ETF, UUP. Click on the chart to get a larger view and to read the commentary.
DXY

FXE

UUP

Here is a brief look at gold ETF, GLD.
GLD

Share It
Tweet
Sunday, December 20, 2009
Standing By
The market continues to trade sideways. The Dow Jones Industrial(DJI), SP500(SPX), Nasdaq 100(NDX) are all trapped in a trading range. The only index that appears to be making a move is the Russell 2000(RUT). The Russell 2000 has been strong relative to the other indices, but it also is trading within a trading range. As the holidays approach, trading volume will start to lighten and one needs to be very careful on false breakouts.
(Click on the chart to get a larger view and for the commentary)
DJI:

SPX:

NDX:

RUT:

The US dollar continues to gain strength. A short term consolidation from recent move is not inconceivable. The recent price actions on the dollar indicated the low for the dollar in this cycle has been made. The catalyst to watch now is the unwinding of the dollar carry trades. Energy stocks could get hit as commodities related carry trades unwind and oil prices retrace below $70 a barrel. Gold and gold mining stocks can also get hit as the carry trades unwind. How much gold prices will retreat is depending on how the market perceives the threat of future inflation. If the market is more concern about the threat of inflation than the strength of the dollar, then gold could be shielded from the unwinding of those carry trades.
DXY:

UUP:

OIH:
I will be standing by if there is significant development in the market that warrants me to put up another post before the holidays break. Most likely this will be my last post before Christmas and I like to take this opportunity to wish everyone a merry Christmas and a happy holidays.
(Click on the chart to get a larger view and for the commentary)
DJI:

SPX:

NDX:

RUT:

The US dollar continues to gain strength. A short term consolidation from recent move is not inconceivable. The recent price actions on the dollar indicated the low for the dollar in this cycle has been made. The catalyst to watch now is the unwinding of the dollar carry trades. Energy stocks could get hit as commodities related carry trades unwind and oil prices retrace below $70 a barrel. Gold and gold mining stocks can also get hit as the carry trades unwind. How much gold prices will retreat is depending on how the market perceives the threat of future inflation. If the market is more concern about the threat of inflation than the strength of the dollar, then gold could be shielded from the unwinding of those carry trades.
DXY:

UUP:

OIH:

I will be standing by if there is significant development in the market that warrants me to put up another post before the holidays break. Most likely this will be my last post before Christmas and I like to take this opportunity to wish everyone a merry Christmas and a happy holidays.
Share It
Tweet
Thursday, December 17, 2009
What A Difference A Day Make
After putting gold back on a trade watch for the next upward move, the market sold it off with a drop of more than $28. Since the gold ETF dipped below the 108 support level, I will wait for the next sign from gold to tell me it is ready to resume its upward move. For now, the long entry that I was watching is off the table. The catalysts I have mentioned could still be played out in the near future. I will continue to watch for signs on which catalyst will emerge or for signs of any new catalyst for gold to move higher.
GLD
As the recent price actions from the US dollar telling us its imminent resurgence, the momentum took a leap forward and broke some major resistance today. Most of today’s drop in the price of gold was due to the strength in the dollar.
DXY

UUP

The Euro took a hit from the dollar, the Euro-dollar ETF, FXE, went below the 144 support level. If the dollar continue to regain its strength (which seem to be most likely at this point), then the unwinding of those dollar carry trades will start to accelerate.
FXE

I have mentioned the weakness in the financial sector previously, and I am continuing to be cautious on the financials. Take a look at the time frame when WFC and BAC did their secondary offering. Don’t get fooled by the false move. Their stock prices were being held up to move those papers. If one look closely at the financials, one can detect the underneath weakness in the sector. I’m staying away on buying the financials.
WFC

GLD

As the recent price actions from the US dollar telling us its imminent resurgence, the momentum took a leap forward and broke some major resistance today. Most of today’s drop in the price of gold was due to the strength in the dollar.
DXY

UUP

The Euro took a hit from the dollar, the Euro-dollar ETF, FXE, went below the 144 support level. If the dollar continue to regain its strength (which seem to be most likely at this point), then the unwinding of those dollar carry trades will start to accelerate.
FXE

I have mentioned the weakness in the financial sector previously, and I am continuing to be cautious on the financials. Take a look at the time frame when WFC and BAC did their secondary offering. Don’t get fooled by the false move. Their stock prices were being held up to move those papers. If one look closely at the financials, one can detect the underneath weakness in the sector. I’m staying away on buying the financials.
WFC

Share It
Tweet
Wednesday, December 16, 2009
Gold & The Dollar Moving Up Together?
Continuing my observation on the US dollar and the carry trades, a slight twist has started to appear that could confuse some casual market observers. Previously I have talked about how the weak US dollar propelled the stock market, the price of oil and the price of gold. Now I’m seeing gold could be making another move upward at the same time as the dollar continues to regain its strength. This seems to contradict the weak dollar, higher commodities prices, and the strong dollar, lower commodities prices scenario.
But did you recall what I wrote back on November 16 about where the price of gold could reach? I stated in that post in order for gold to reach the next level near $1300, it will be a different catalyst other than the weak dollar. And I believe this trend change for the dollar and the price of gold to move up together is due to a new catalyst. This catalyst could be the resurgence concern on the long term inflation due to the massive liquidity the Fed has injected into market and the possible early rate hike from the Fed, or a short term catalyst like the possible preemptive military strike on Iran to remove the threat of Iran developing nuclear weapons. These possible catalysts could cause the dollar and the price of gold to move up in unison. And yes, short term, the price of oil could spike up as well due to possible short term interruption of the oil supply from the possible military action. In regardless which scenario is at play, from the price action of the dollar and the price of gold, they are definitely appear to be moving to a higher level.
Here are the latest charts with my commentary. Click on them to get a larger view.
GLD

DXY

UUP

FXE

Share It
Tweet
Sunday, December 13, 2009
Continue To Watch The US Dollar
It was another week of sideway trading for the market. The weakness from the financial and energy sectors is being compensated by the strength from the tech, industrial and consumer discretionary sectors. Until this balance of power is changed, I am expecting more sideway actions to continue for the market. The catalyst that can alter the current balance of power is the US dollar.
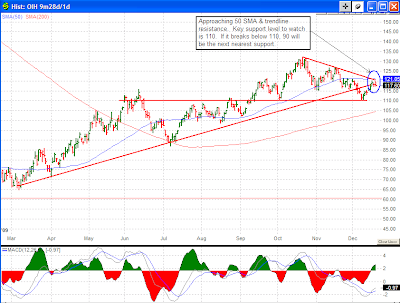
As the dollar gains strength, those dollar carry trades will be unwounded and that will bring to the end of this round of musical chair. To monitor the movement of the dollar, I have put up the following charts with key levels identified for potential breakout. In addition, I have also taken a closer look at the financial. It appears something might be developing that could cause a major break for the market. Whatever that might be, only time will tell. For now, one might take a look at some individual stocks in this sector, i.e. GS, WFC, JEF, JPM, MS, and BAC, to get a sense of the developing weakness in this sector. I will post more about the financial and some possible scenarios to watch for 2010. In the meantime, here are the charts. Click on them to get a larger view of the chart.
DXY

UUP

FXE

OIH

USO

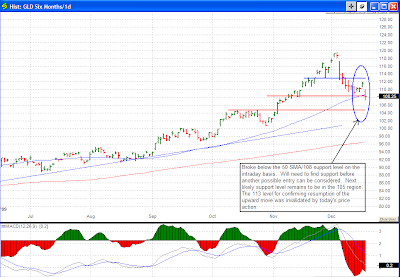
GLD

XLF
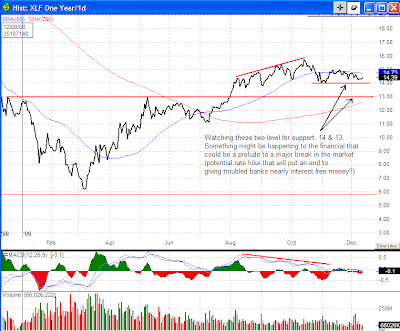
As the dollar gains strength, those dollar carry trades will be unwounded and that will bring to the end of this round of musical chair. To monitor the movement of the dollar, I have put up the following charts with key levels identified for potential breakout. In addition, I have also taken a closer look at the financial. It appears something might be developing that could cause a major break for the market. Whatever that might be, only time will tell. For now, one might take a look at some individual stocks in this sector, i.e. GS, WFC, JEF, JPM, MS, and BAC, to get a sense of the developing weakness in this sector. I will post more about the financial and some possible scenarios to watch for 2010. In the meantime, here are the charts. Click on them to get a larger view of the chart.
DXY

UUP

FXE

OIH

USO

GLD

XLF

Share It
Tweet
Subscribe to:
Posts (Atom)