Thursday, July 30, 2009

Changing Behavior

The first three trading sessions of this week, the market open and traded lower in the morning, and then it slowly climbed back up and closed with a surge of buying to regain all the loss grounds given up in the morning trading. Today, the market opened up strongly, and then it retreated and confined itself in a trading range until near the end of the session. During the final hour of trading, the market tries to rally in an attempt to move itself at least back up to the intraday high. The rally failed to move the market back to its intraday high and ended the trading session with a spur of selling.

What happened in the market today is nothing new, but what is new is the market has changed its behavior, from a buy-the-dip to sell-the-rally. This change in character tells me to be cautious of a possible pullback. With the underlying technical that already signaling the market is over extended, I will be a bit quicker to pulling the trigger to take whatever profit the market gives me. I worry about the runaway moves later if I happen to miss them. For now, I am more in the capitals preservation mode than being aggressive long or aggressive short.

The daily charts below give a broad picture on what is going on, but the real picture is hidden in the intraday charts. Who knows, maybe after tomorrow’s GDP report, the market will rally big time. All I know for now is there was a change in the market's behavior today.

Daily charts:


Intraday Charts:


Share It

Monday, July 27, 2009

Defiant

The market not only resilient, but it is also defiant. After the disappointed earnings report from MSFT, AMZN and AXP on last Thursday, one would have thought the market would be down last Friday. Think again, the market will humble us every time when we believe we got it all figured out. Instead of a down day on Friday, the DJIA and SP500 continue to move up, and the only thing that the disappointed earnings did was to halt the recent Nasdaq's winning streak to 12.

Today with the market trading down, it gave the appearance that the awaited pullback finally has arrived. Once again, the market defies us by regaining all its losses and closed with a modest gain for all three major indexes, DJIA, SP500, and the Nasdaq 100.

By any technical standard, the market is over extended and it is due for a pullback. But we all know whenever the herd is expecting the market to do something, the market will remind us who is in charge by doing the contrary.

Here are the updated charts, click on them to see what are some potential resistance levels.


Instead of fighting the tape and trying to outwit the market, I will keep trading with the trend until the market tells me to do otherwise. If I feel a bit hesitant, I will reduce my position size and tighten my stop. If I'm in doubt, I will stop trading until it is clear. This is a much better strategy than shorting this market and have the stops blown away by those buy-the-dip rallies. Yes, I still believe this is a bear market rally, but that doesn't mean I will stop trading the uptrend if that is the prevailing trend.

I will stick with my scenario until the market tells me to change course. I do not make money by correctly calling the market direction, I make money by being on the right side of the trade. Therefore, when in doubt, stop trading.


Share It

Thursday, July 23, 2009

Lucky 13?

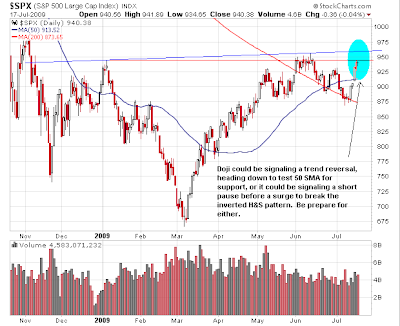
Today was a powerful up day for the market. After a brief testing of the inverted H&S neckline in the previous session, the DJIA forged ahead and gained more than 180 points. The SP500 joined the party and broke thru its inverted H&S pattern and made a seven month high. And the Nasdaq continues to amaze with its 12 consecutive up day. So will tomorrow be Nasdaq’s lucky 13?

After the market close today, MSFT, AMZN and AXP reported disappointing earnings and all three of them got hammered in the after hour trading. This will definitely put some downward pressure on the market tomorrow. And this could bring the current consecutive up day streak for the Nasdaq to end at 12.

Here are the charts. To read the commentary, click on the chart to get a larger view. Tomorrow could be the start of the long awaited pullback for this rally. After the pullback has started, I will start labeling the possible support levels to watch. Until then, trade well.


Share It

Wednesday, July 22, 2009

Resilient

The market has been very resilient lately. Whenever it appears the bears might gain an upper hand, the bulls charge right back and retake control. The Nasdaq has been up for 11 consecutive sessions and the positive earnings reports and outlooks from the tech sector continue to provide the fuel for moving the Nasdaq higher.

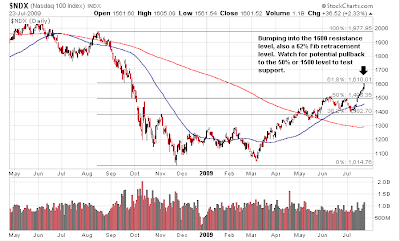
Today, the Nasdaq 100 reached the double bottom measured move level, and it might not encounter resistance until it reaches the 1600 level.


The DJIA broke out of the inverted H&S pattern yesterday and today it pulled back toward its neckline to test for possible support.


The SP500 encountered resistance at its inverted H&S neckline and pullback away from it.


Definitely, the market is at a juncture it can move strongly in either direction. Therefore, to initiate new positions before the market has decided which direction it will take can be very risky here. If you are long, the best move is manage your long positions with tight stop, and if you have survived the pains for holding on to your shorts, then maintain your stop, your reward could be just around the corner.

In the short term, the market is more likely to pullback from its current over extended level. With only seven trading days left in the month of July, it is very unlikely the market will drop to the March 2009 level before the end of the month. As August and September approach, the seasonal summer rally could give the market another surge before it resumes its primary downward trend. If you believe this is a bear market rally, then without having the market bottomed in July, the expected economic recovery in the second half of 2009 is off the table. The earliest we can look forward to a possible recovery is in the year 2010. If the market bottom in October 2009, then a possible recovery could begin near the end of first half of 2010. For now, the good news is the market has been up, and the bad news is the economic recovery is still not in sight.


Share It

Saturday, July 18, 2009

Tech Again

What a week, the day before GS reported, the financials got the market going. After INTC reported a blowout earnings performance in after hours, the tech is off and running once again and the market took off. GOOG didn't blow anything away and the market dumped it. IBM came to the rescue with a positive earnings report and revised its projection upward, and that kept the rally going. AAPL continue its climb, setting up for earnings report next week. The strength continues to be TECH!

Looking at the DJIA and the SP500 charts, the charts show these two indices rallied off the recent low quite nicely and quickly. But Friday's performance shows they could be a bit exhausted and getting ready to pullback for a test. Of course this can be all changed depending on MSFT and AAPL earnings and outlook due out next week. So prepare for another tech week. The earnings report season will be in full steam next week, lot of the companies will report they met their bottom line number, but no growth or shrinking top line. These reports will reinforce the BS on the 'green shoots' claim. If the companies' top line is not growing, economy will not be growing, and employment will continue to decrease.


The three notable techs to report earnings next week, AAPL, MSFT and YHOO:


Share It

Wednesday, July 15, 2009

Heads Up

After INTC reported blowout earnings and its stock price moved up more than 7% in yesterday after hours trading, I was not surprised to see the market pop today. What I was surprised by was the result of the move. Some of the market bearish technical have been cleared and the market direction could be changing once again from today's price actions by the DJIA, SP500, and Nasdaq 100.

Take a look at the following chart pattern.


Does it look familiar? It should if you have been watching the SP500 closely rather than just focus on the highly publicized head & shoulder pattern. This is a flipped chart of the SP500 showing a head & shoulder pattern being formed.

Here is the right-side-up SP500 chart, notice the potential inverted head & shoulder pattern being formed:


Here are the charts for the DJIA and the Nasdaq 100:


The market is full of trickery, so be alert and trade with the market, not against it.


Share It

Tuesday, July 14, 2009

Non-Eventful

GS reported blowout earnings today, and the market went into a non-event mode since the financials have made their move yesterday ahead of GS’ report.


The Nasdaq didn’t move too much ahead of INTC’s earnings in today’s session. But in after hours, INTC reported $0.18 vs. $0.08, and the stock moved up more than 7%. This positive surprise from INTC and the AH pop on INTC’s stock should give the market a push tomorrow since it didn’t anticipate INTC’s results.

Even though these indices are being pushed higher by the positive earnings reports, the trend is still down. Until the resistance levels have been taken out, and a series of higher highs and lower lows is made, the risk of being trapped by chasing the longs is too great.

Here are the latest charts for the DJIA, SP500, and Nasdaq 100:


The charts for the three big tech stocks I am following for this earnings week: IBM, GOOG, and INTC


Share It

Monday, July 13, 2009

Shakeout

After a few down weeks and breaking the highly publicized SP500 head & shoulder pattern, the market did a bit of shakeout today by gaining more than 2%. Today's shakeout took out some of the bears that went short on the break of the H&S pattern. For those seasoned market technicians, they are all aware a retracement will occur whenever a pattern is broken and they will wait for the retracement to enter. More importantly, the probability of a failed pattern when one of those highly recognizable patterns is broken is high (especially when all the talking heads are balking about it.) Does it mean after today's performance, the market is on an uptrend? No, not until it has taken out the lower highs and lower lows by forming higher highs and higher lows.


For me, earnings report will officially start tomorrow when GS put out the numbers before the market tomorrow. Here are the charts for the three tech stocks that will be reporting their earnings this week: IBM, INTC, and GOOG.


Share It

Sunday, July 12, 2009

The Tech

All three indices, DJI, SPX and NDX finished the week on a down note.


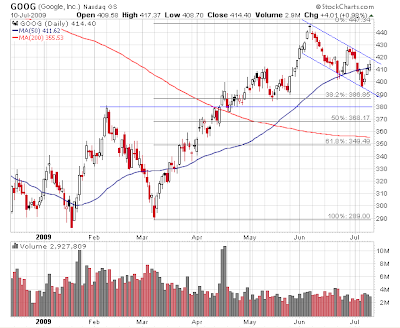
Next week some notable tech companies will report quarterly earnings, i.e. IBM, GOOG, INTC. Looking at the chart for these stocks, INTC appears to be the only one might react positively on favorable earnings report and positive forward projections. The price action for IBM and GOOG look more like “sell the news.” If IBM breaks below 100, 96.50 could be its next support. Unless GOOG breakout of the downward price channel, it could be heading down toward the 380-390 level. These tech earnings reports could trigger the tech sector selloff and that will lead the market down. I will be watching these stocks for the next market movement.


Share It

Thursday, July 9, 2009

Chronicle Of A Trend Change - The Flip Side

I just flipped the chart in the previous post to show how the chronology for a trend change from up to down would look.


Share It

Chronicle Of A Trend Change

Here is a chart pointing out some of the key things to watch in order to identify a change in the trend.


Share It

Wednesday, July 8, 2009

Late Day Recovery

The market was down most of the day until it rally near the last hour of trading. The DJIA recovered all of its losses and ended the session in the black. Similarly, for the Nasdaq 100, it also recovered and closed with a small gain. The SP500 was trying to end the session with a gain but it just did not have enough strength to push it above yesterday’s close and ended down a little bit over a point. What today’s late rally did is to provide a potential pivot point for the price charts to establish a new down trend price channel. In addition, due to the late day rally, a hammer like candle was form and this can lead to an oversold rally in the coming days. Unless these indices reclaim the previous high, the current trend is to be considered down. I will be very suspicious on ensuing rallies and I will be looking for opportunities to trade the downside.


Share It

Tuesday, July 7, 2009

Lower High, Lower Low

The three major market indices, DJI, SP500, and Nasdaq 100 finally have broken their support and made lower high and lower low. Although today's trading volume was on the light side, but don't be misled. When the market makes big drop with low volume, it is due to lack of buyers, not due to lack of sellers. Take a look at the charts below, you will see similar price pattern of lower high & lower low on many stock charts. This implies the trend change is broad base. Today's break spells the end of this bear market rally. I will be unwinding my longs and start preparing for the down trend.


Share It