Monday, November 16, 2009

Where Is Gold Going?

I was asked where do I see gold will be heading. Looking at the inverted head and shoulder pattern that took more than a year to develop, the measured move for the gold ETF, GLD is in the 131 region. This translate to gold prices above 1300 an ounce. I have been hearing some talking head projecting 1400 an ounce. So we'll see. I don't believe the weak US dollar will carry gold to the 1300 level. It will most likely be some other catalyst to move gold up to the 1300 level and above.

GLD:


Share It

Back To Neutral

Today, the market continues its march to higher ground. The Dow 30 closed at another new high, bringing along with it this time is the SP500, NYA, NDX, and more importantly the Dow Transport. The reason for the importance on having the DJT confirming the DJI new high is it tells me the DJI will make newer high before this rally terminate. Today’s confirmation by the DJT removes the bearish stance and put the market back to neutral for me. I will revert back to bullish stance after some of the divergence has been removed. Still there are sectors continue to lag and the Russell 2000 still trading below its recent high.

Here are the updated charts. The DJI and SP500 are getting near their weekly bull flag measured move. These measured move levels will likely be the near term target for the DJI & SP500.

DJI:


DJT:


SPX:


NYA:


NDX:


Share It

Sunday, November 15, 2009

The Fallen Leader

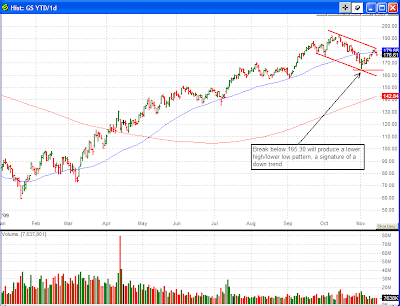
Until recently, financial sector has been one of the leading sectors that help drove the market to the October high. Now, the financial is no longer one of the main catalysts that are pushing the market to its recent high. Take a look at the financial ETF, XLF, and the top four holdings in the XLF; JPM, BAC, WFC and GS, and you can see the head & shoulder price pattern are being form on JPM and WFC, and lower high/lower low trend is being form on BAC and GS. These bearish price patterns can eventually lead the market down. As one sector fall, others will follow. Be very cautious on the financial.

Here are the charts:


XLF:


JPM:


BAC:


WFC:


GS:


Share It

Saturday, November 14, 2009

Waiting For Confirmation

Although the market ended another week with a gain, but the market did it with a lot of uncertainties. In the intraday chart, signals are being flashed by some broad market indices warning of an impending price trend change and other market indices continue to march higher. In the daily price chart, incomplete bearish price patterns temper the bullishness. And the weekly price charts show the uptrend price channel started in March 2009 remain intact.

It is moment like this that the traders must look at the technical from multiple time frames to get a complete picture (if multiple time frames are not part of the routine review). In my recent post on my blog, I have pointed out some of the bearish signs from my review of the intraday and daily price charts, and in this post I will present my review on the weekly price chart.

The market based on the weekly chart still appear to be on the upward trend, but I am still in the mildly bearish side due to conflicting signals from the intraday and daily price charts. I will be completely bearish when the market gives me a full confirmation it is heading down. If the market takes out those potential bearish price patterns that I am monitoring, then I will revert back to the bullish camp.

Here are the weekly charts showing potential target level from previous bullish pattern formations. Be careful on interpreting the measured move projections. I normally consider a projected move have attained its target if it has made 85% of its measured move. In other word, I don’t necessary wait for the price to reach the projected price level before I terminate the pattern if there are conflicting technical.


DJI:


SP500:


Nasdaq 100:


Russell 2000:


Share It

Thursday, November 12, 2009

Another Turn Is Coming

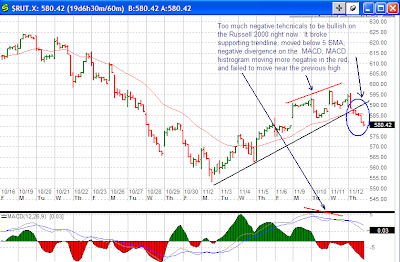
You can sense the recent rally is running out of steam, and today it shows. In this post, I will simply highlight some of my observations on the intraday hourly price chart to show the price trend is getting ready for another turn downward. Whether this is another pull back or this will turn into a price reversal, I will not draw any conclusion one way or the other until after the daily price patterns are completed. For now, I will remain in the mildly bearish camp.

Here are the charts with my observations. Click on the chart to get a larger view to read my commentary.

DJIA:


SPX:


NDX:


RUT:


Share It

Wednesday, November 11, 2009

Continue To Be On The Alert

Today the DJI closed with another new rally high at 10,291.26. Although this time the SP500 did sneak in a new high by closing at 1098.51, 0.60 point above the previous closing high of 1097.91 made on 10/19/2009, and the Nasdaq 100 continues to close at a new high along with the DJI. But the DJT, NYA, and the Russell 2000 continue to lag and failed to close with a new rally high. Until the DJT and NYA confirm DJI newer high, I will remain to be on the alert for potential downside reversal.

Here are the updated charts showing the latest closing level:

DJI:


SP500:


Nasdaq 100 (NDX):


DJT:


NYA:


Russell 2000 (RUT):


Share It

Monday, November 9, 2009

Who Is It Fooling?

The market had another big up day today. The Dow Jones Industrial index made a new closing high off the March 2009 low. If this momentum continues, I will not be surprise to see the DJI reach 10,500, which is the measured move from the weekly bull flag pattern formed in July. But, with the broader market indices such as the SP500, NYA and the DJT failed to confirm the DJI new high, this raises doubt on the extent of this rally.

Until some of these broader market indices confirm DJI’s higher high, I would rather miss this leg of the rally than get fooled by getting trapped long near the top.

Here are the updated charts, click on it to get a larger view:

DJIA:


DJT:


SP500:


NYSE Composite:


Nasdaq 100:


Share It

Saturday, November 7, 2009

Impressive Stock Market Performance, But...

The market put in an impressive performance last week after the Fed decided to keep the US dollar low and the US unemployment rate exceeded 10%. On the surface, one would think all coast are clear for a big yearend rally. But if one looks closely, there is still lot of technical uncertainties to be bullish or to be bearish.

Look at the Dow Jones Transportation index, it has formed a double top and bounced off a support level that could turn out to be the neckline of a double head & shoulder formation. Until it can clear the October high of 4066.40, it will be considered in the process of forming a lower low/lower high down trend.


The Russell 2000 displays a similar price pattern as the DJT. If the RUT cannot take out the September high of 625.31 and break below the 550 support level, then that will be the first sign this rally is coming to an end as money is moving toward the big cap stocks such as the Dow 30 (flight to quality).


During the recent pull back, the DJI made a higher low and held above the supporting trend line, and it appears it has enough momentum to test the October high of 10119.47. If it clear this high, 10,500 will be the next target.


Unless the SP500 move above 1100 to get itself back in sync with the DJI, then it is another sign the market could have already made an internal top. During the recent pull back, the SP500 held the 1025 support and move back above the 50 SMA. In the last session, it was testing the resistance level near 1070. If it failed to push through this resistance level, the SP500 could be setting itself up with an H&S pattern.


A similar price pattern is also being formed by the Nasdaq 100. It held the 1650 support level and if it cannot take out the October high of 1780.83, a potential H&S is in the making.


Next week the market should give us a better idea on where it will go. Until some of those potential bearish price pattern formations are invalidated, I will not be a buyer. I will either be a cautious bear or move to the sideline until the picture is clear. The market is clearly telling us it is getting near the top if it is not already there, and giving us signs to be cautious.


Share It

Sunday, November 1, 2009

Where Is The Stock Market Heading?

My outlook has not changed since my last post. I will just briefly give an update on the SP500 and reiterate the level I am monitoring on the following charts. For a refresher on the key levels I am monitoring for the DJIA & Nasdaq 100, see my previous post.

Click on the chart to get a larger view to read my commentary.


Share It