Monday, May 30, 2011

Showing Signs

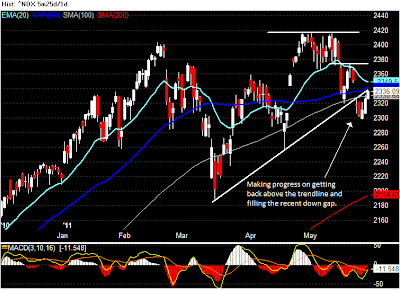
The month of May is coming to an end and the market indices are showing signs of regaining supports, and they appear to be setting up for the next potential uptrend.

Here are the updated charts for the SP500, Nasdaq 100, and the Russell 2000.

SP500:


Nasdaq 100:


Russell 2000:


Share It

Wednesday, May 25, 2011

Russell In Trouble

The Russell 2000 broke below its trendline support and its 100 SMA near the 816 level, and this could spell trouble. Next likely test for support will be the March 2011 gap at 795.


The SP500 came within 0.11 point on filling its April 2011 gap. If it doesn't close above the 100 SMA, look for 1295 to be the next likely level to test for support.


The Nasdaq 100 filled its April 2011 gap and next potential support will be near the 2255-2260.


Share It

Sunday, May 22, 2011

Critical Watch

The market is at a crossroad once again. After OpEx week, the major market indices are at a point where they will either resume it ascend to newer high or face a critical test of support near major moving averages. If the indices failed to hold support, it could be the start of a new down trend. While the market is under critical watch, I will continue to be on the sideline.

Here are the updated charts, click on them to view a larger image and to read the commentary.

SP500:


Nasdaq 100:


DJIA:


Russell 2000:


Share It

Monday, May 16, 2011

Trying To Catch A Second Wind

The market is appearing to be running out of breath and trying to catch a second wind. The SP500 has found temporary support near a supporting trendline. But the recent downside momentum might push this index down to test the 100 SMA for support and to fill the 4/20/2011 opening gap near 1312 level.


The tech heavy Nasdaq 100 was dragged down by AAPL & GOOG, both of them were down more than 2% today. This index is trying to hold support at the 50 SMA, and it’s only about 26 points away from filling the 4/20/2011 opening gap near 2306. Having a supporting trendline crossing the 2306 gap level, the 2306 will act as a magnet to pull this index to fill the gap.


Until the market re-establish support or made a clear break on the downside, I will be on the sideline.


Share It

Wednesday, May 11, 2011

YOKU - 5/11/2011 (Stopped Out)

YOKU - 5/11/2011 update

The swing long trade initiated on 5/6/2011 with the setup of bouncing off supporting trendline and the 20 EMA failed to gain upside momentum. Today, the price declined below the stop loss level and the trade was closed out with a 1R loss when it hit the stop loss level. With the price moving below the previous low, it is now forming a lower-high/lower-low downward trend. Until this price pattern reverses, no new long position will be considered.


Share It

Saturday, May 7, 2011

YOKU - 5/6/2011 (Long)

YOKU - 5/6/2011

Here is my first trade on this China internet stock YOKU that went IPO last December. The setup is based on the bounce off support trendline and the 20 EMA. A swing long position was initiated on 5/6/2011. Click on the image to view the commentary and the various exit levels planned for this trade. I will post updates for this trade as it moves along.


Disclosure: long on YOKU.


Share It

Thursday, May 5, 2011

The Falling Knife

Yesterday the price of the silver ETF, SLV was near a potential support level of 37 and its 50 SMA. When SLV open for trading today, it gapped down to open at 36.53 and made a feeble attempt to retrace to test the 37 for resistance. After retracing only to the level of 36.89, it resumes its decline to the mid 33 and finally halted the decline for the day when it touches the 100 SMA.

When the price drop like a falling knife, it is best to avoid the temptation to bottom fishing. Otherwise, one’s trading account can get cut up very quickly. For now, even if SLV finds support at 33, I will wait until it has bounced off the support before considering taking any position on it.


Share It

Wednesday, May 4, 2011

Same Old Game

This is the same old game being played over and over again. Whenever a market gets too speculative (one sided), the margin is raised to take out the excess. This is exactly what has happened to the silver market this week. The CME increased the margin and triggered a sell off on silver. This in turn triggers a sell off on the silver ETF, SLV. As the price continue to fall, it triggers more margin call selling, and that forces liquidation to take place on other assets to cover margin call and losses.

Since the price of silver has fallen, the SLV has fallen more than 20% in less than a week from a high of 48.35 on 4/28/11 to today’s intraday low of 38.01. Now that silver has dropped more than 20%, what's next?

Looking at the price chart of SLV, there could be an oversold bounce when it hit a potential support near 37. This is a previous resistance level when SLV was on the way up, and it is also near the 50% Fibonacci retracement level between the 4/28/11 high and the 1/25/11 low. Furthermore, the price is near the 50 SMA and when it moves below the 50 SMA, a test on moving back above this moving average is not unusual. The bottom line is, it’s a bit late to initiate new shorts, and too risky to go long. I would watch for a bounce back up to the 40 level and see how the price holds up, then I will look for long or short entry.


Share It