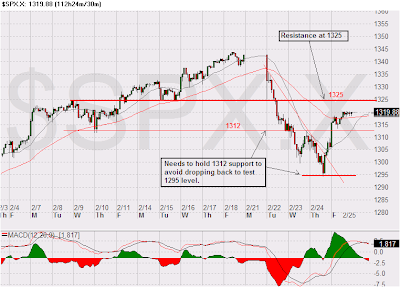
SP500:

DJIA:

The Nasdaq 100 actually started its bounce a day earlier. Both days when it dipped below the 50 SMA, it bounces back above it.
Nasdaq 100:

These bounces off the 50 SMA formed an intraday double bottom pattern for the Nasdaq 100 with the low around 2284. This intraday double bottom pattern has a measured move target level around 2352. There is also a resistance level near 2366.
Nasdaq 100 Intraday:

The intraday chart for the SP500 shows the 1312 level appears to be a resistance turned support level. If the SP500 can hold above the 1312, then the next level of resistance is 1325.
SP500 Intraday:

The DJIA bounced off the 12,000 level and it is testing the 12,150 resistance. If it can get through the 12,150, next likely resistance level will be 12,200.
DJIA Intraday:

The market appears to have found some short term supports, but the uncertainties in Libya will keep the market on edge.