The market closed down on Friday with the SP500 down 5.21 at 1841.13, DJIA down 43.22, Nasdaq 100 (tech heavy) down 23.63, and the Russell 2000 gained 4.67 points. The more interesting stat is the advance and decline issues, the new high and new low. Although the DJIA and SP500 were down, the advanced issues outnumber the declined issues in the NYSE and in the Nasdaq. Furthermore, the number of issues made new 52 weeks high outnumbered the issue made new 52 weeks low. Even the up/down volume is relatively flat. Based on these market breadth indicators, it does not appear the market is in a corrective mode (sell off). It seems like the market simply locking in profits from some of those recent high flyers and avoiding emotional selling from those with weak hands and prepares to take advantage of the potential bargains.
The market is showing sign of internal weakness as it is hovering near its all time high territory. This could be an early indication of a market top is near. But until the market has formed a top, one should continue to be defensive at this juncture of the market cycle. For this reason, one should be aware of the potential support levels for the market to hold rather than how high the market can go.
NYSE:

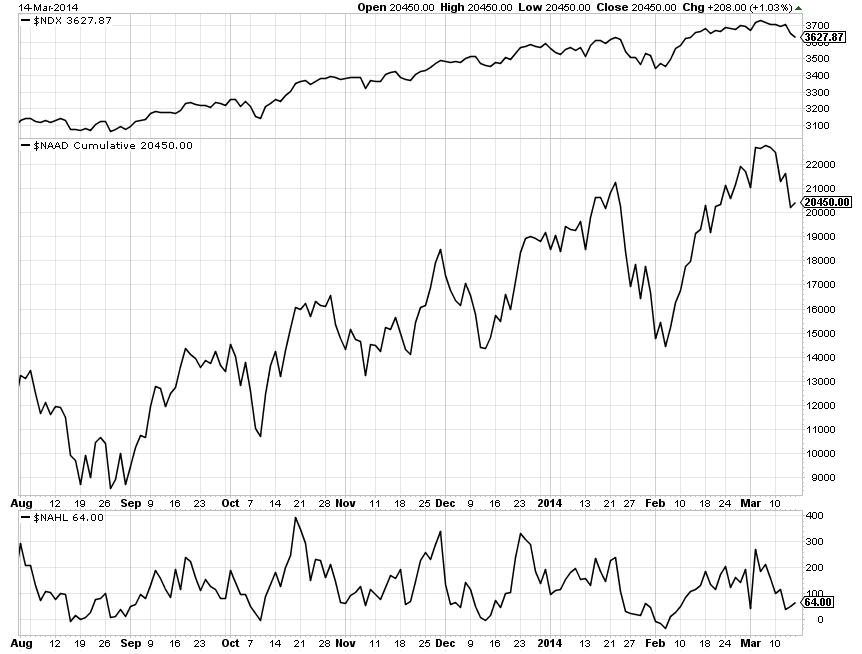
NASDAQ:
In this video, a look at the market indices and the potential support levels to monitor, and a review on the following stocks: FB, TSLA, TWTR.
Click here to view the video if you do not see a video player on your screen.