It is no surprise that the top performing market index was the Nasdaq 100 since the so call F.A.N.G (Facebook, Amazon, Netflix, Google) is in the Nasdaq 100. The Nasdaq 100 gained +8.4% for the year. And the worst performing index was the Dow Jones Transportation, it lost -17.8% in 2015. The table below (Table 1) shows the performance of each major market index from best to worst YOY (year over year) order. Notice how small the losses are for the SPX and DJI while the broader market index, NYA has a much larger loss. This highlights how the SPX and DJI are being held up by a few stocks to give the ill-informed market participant the perception that the market is doing good.
 |
| Index YOY Performance Table 1 |
Although the NDX was the best performer in 2015 and it ended the year with a gain, but it still finished 2015 at -3.1% below its high of the year. Again, the DJT was the index that closed furthest from its high and closed at -18.%% from its 2015 high. All the indexes ended 2015 with a close below their high. Table 2 listed the indexes in the order of nearest to furthest close from their 2015 high. One must wonder why the DJT has not performed better if the airlines and shipping companies were to benefit from the low oil prices, and start questioning is the poor performance from the DJT due to a slowing economy!
 |
| Index Closed Relative To 2015 High Table 2 |
The highest gain attained during the year was the NDX, it's peak was a gain of +11.9% over 2014 closed. The DJT peak was just a touch above its 2014 close, a measly +0.8%. Table 3 below listed the indexes in the order of highest gain to the least gain during 2015. What this table also show is all the indexes were above their 2014 close at some time during 2015, even the worst performer DJT.
 |
| Index Highest To Lowest Gain During 2015 Table 3 |
To no surprise, the index experienced the largest loss during the year was DJT. It experienced a loss of -19.5% from the 2014 close. The surprise is the index that experienced the smallest loss in 2015 was not NDX, it was SPX. SPX experienced a maximum loss of -9.3% versus a -10.6% maximum loss from the NDX. Here is how the indexes rank in the order of most to least loss during 2015 (Table 4).
 | |
| Index Most To Least Loss During 2015 Table 4 |
Finally, here's how the indexes rank based on their swing between the high and the low in 2015 (Table 5). The DJT incurred a maximum loss of -20.1% from its high during the course of 2015. This barely pushes it into what some define as bear market. But it didn't stay in a bear market for long, the DJT closed 2015 at -18.5% from its high.
 |
| Index Highest To Lowest Loss From 2015 Prior High Table 5 |
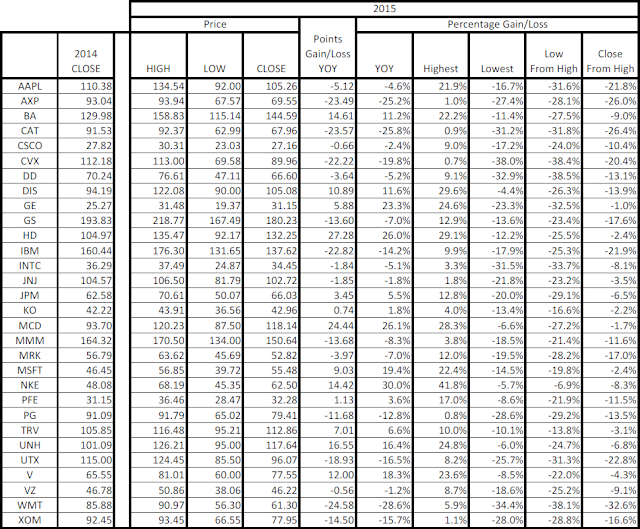
Let's take a look at the DOW 30 stocks. In this table (Table 6), the stocks in the DJI are listed in alphabetic order.
 |
| DJI 30 Stocks Table 6 |
The following table (Table 7) ranks the DOW 30 stocks based on their YOY gain. NKE has the highest YOY gain with +30% and WMT has the largest loss of -28.6%. There are only 13 out of 30 stocks, less than 50% of the stocks in the DJI ended 2015 with a gain. Imagine that, the DJI only loss -2.2% for the year!
 | |
| DJI 30 Stocks YOY Performance Table 7 |
The stock in the DJI that finished 2015 closest to its high is GE. It closed only -1.0% away from its high while the best YOY performer, NKE finished 2015 -8.3% below its high. WMT holds the title of furthest away from its high with a close of -32.6% from its high. The following table (Table 8) lists the stocks from closest to furthest from its high. The table shows 7 out of 30 DOW stocks ended 2015 in bear market territory (greater than 20% below the high), they are CVX, AAPL, IBM, UTX, AXP, CAT and WMT. -2.2% loss for the DJI, hmmm!
 |
| DJI 30 Stocks Closed Relative To 2015 High Table 8 |
NKE has experienced the highest gain during 2015 with a gain of +41.8% above 2014 close and CVX experienced a high only 0.7% above 2014 close. Table 9 lists the stocks based on largest gain to smallest gain during 2015.
 |
| DJI 30 Stocks Highest To Lowest Gain During 2015 Table 9 |
CVX has experienced the most loss during 2015 and DIS has experienced the least loss. Here is a look how the DOW 30 stocks rank based on losses experienced during 2015 (Table 10).
 |
| DJI 30 Stocks Highest To Lowest Loss From 2015 High Table 10 |
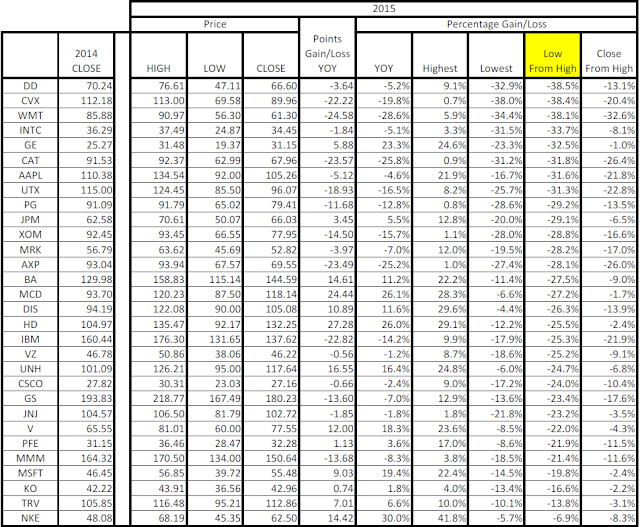
Table 11 listed the DOW 30 stocks based on maximum losses from their high. DD has the highest swing loss between its high and low of the year while KO has the least. The interesting thing is only four DOW stocks did not experienced a loss of 20% or greater during 2015, and they are NKE, TRV, KO and MSFT. This implies 26 out of 30 stocks in the DJI had entered into bear market during 2015 and 7 ended 2015 in bear market territory (see Table 8).
 |
| DJI 30 Stocks Highest To Lowest Loss From 2015 Prior High Table 11 |
One important thing to gleam from 2015 is how the SPX and DJI are being held up by a small number of stocks. This is a reminder to all not only watch the index itself, but look underneath the surface is see what the market is really doing. To truly gauge the strength of the market, one must watch the market breadth. The 2015 market was under heavy manipulation by the central banks and one should expect the same in 2016 until they run out of options.
Wishing everyone a healthy and a prosperous 2016!