Today’s rally has resolved the concerns that I have expressed in the post "
Likely To Go Higher". The divergence between the DJ Industrial and the DJ Transportation has been rectified and the Dow Theory non-confirmed low remains to be valid. More importantly, the breadth indicator that did not provide the confirmation came through with a validation that the current upward move is supported by market breadth.
Here are the updated charts for DJI, DJT and SPX. The levels below the price are potential supports and levels above the price are potential resistance/target.
DJI:
(Click on the chart to enlarge)
 DJT:
DJT:
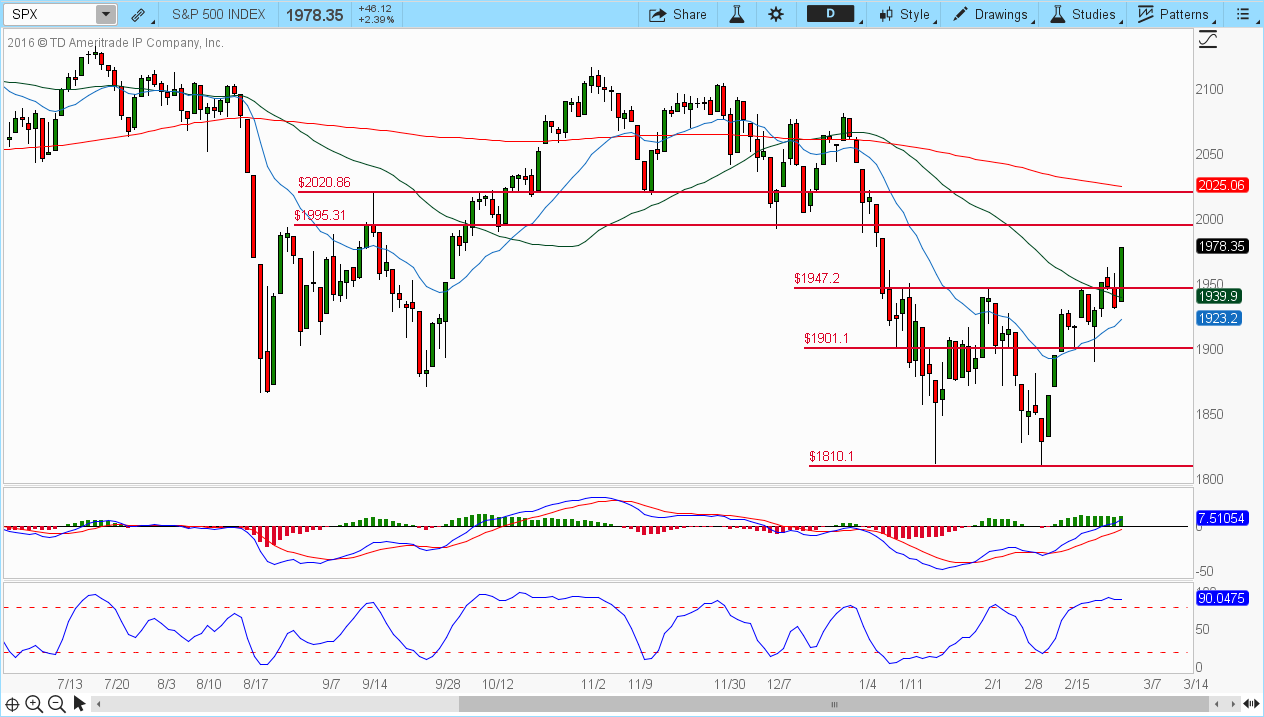
 SPX:
SPX: