Wednesday, June 24, 2009

Where Is This Heading

Now that option expiration has passed and the Fed meeting is over, we can finally get back to watch where the market is heading. In just a couple trading sessions, the market has given us a sense of change is in the work. This mean trading pattern will be different than the last month or so where it been moving more in a sideway pattern. If the market is heading down, expect the volatility to increase. Let see what the market is telling us.

From the DJI daily chart, it is still hanging inside the price channel. It has broken below the 20 EMA, 50 & 200 SMA. Unless it can move above the recent high near 8880 level before it breaks below the price channel, then this bear market rally has come to an end. (I have put up the 20 EMA to watch the short term trend, just another trend confirmation tool I use.)


The SP500 is also showing it is hanging inside its price channel. It has broken all three moving averages, similar to the DJI. If it breaks below the price channel, then 800 could be the next support level. To reaffirm the upward trend, it must move above the recent high near the 950 level.


In the tech heavy Nasdaq 100, it is trying to hold above the May's high. Unless it can move back into the price channel, it is very likely it will fall to the next support level near 1350.


As one can see from these market indices, the market is definitely at an inflection point where it can rally to newer high or it can reverse and go test the March 2009 low. I not am going to guess which direction the market will move. But I am preparing for the downside if it has decided to terminate this bear market rally. What I am expecting is within the next few trading sessions, the market will have decided where it is heading.


Share It

Monday, June 22, 2009

What Is Happening

What a way to start the week after the quadruple witching options expiration. The DJI finished off more than 200 points, the SP500 closed down more than 28 points, and the Nasdaq 100 loss almost 45 points. Advance/decline was in favor of the declines by more than 7:1 in the NYSE, and over 5:1 in the Nasdaq. The up/down volume was also in favor of the downside by over 14:1 in the NYSE and slightly under 9:1 in the Nasdaq. Based on these stats, the market was definitely being sold off today. There are people claiming this is simply profit taking to lock in Q2 profits, and others are saying this is the start of a correction.

Whatever the reason it might be, I am watching those key levels (see charts) to be breached before I draw any conclusion on the direction of the market. Until then, I will remain cautious and leaning more toward neutral. When it is unclear, the best position to take is no position. Trade cautiously until things are clear.


Share It

Sunday, June 21, 2009

The Coming Move

Now the quadruple witching options expiration is behind us, we should get a clearer picture on what the market might do. Next week is the last week of the quarter, and end of the quarter window dressing activities should occur.

Looking at the daily chart for the DJI, it shows the DJI consolidated above the 200 SMA near the 8750 level then the DJI dropped below the 200 SMA and tested the 8500 level. Now it appears to be getting ready to move back above the 200 SMA. Key resistance level to watch is the 8750, it needs to move above this level in order to maintain its upward trend toward the 9000 level. If DJI fails to move above and hold the 200 SMA for support, the 8250 support level could be in play and this could be a sign the DJI is about to turn over.


For the SP500, it has remained above the 200 SMA. It consolidated near the 940 level then retreated below the 925 level and tested the 200 SMA for support. It appears to be moving back up toward the 950. It is trying to clear the 925. The 50 SMA is also readying to cross over the 200 SMA. When it clears the 950 level, 1000 will be in sight.


The Nasdaq 100 came down and filled the early June gap and bounced off the May high. The strength in tech stocks continues to keep the Nasdaq 100 trending upward. First sign of caution will be if this index does not break above the 1510 level and retreats back below the 50 SMA.


I will continue to play on the side of strengths, which will be the tech. Being very selective on financial and transport. Avoiding energy as it is mixed and crude is extended. Also I will be reducing my position size until the major indices have move above the recent high. I will maintain a cautious bullish stance.


Share It

Sunday, June 14, 2009

Sectors Review

As the market is consolidating to get ready for its next move, I thought it would be a good opportunity for me to post my review on some of the market sectors. Before I proceed, I like to recommend all my readers to visit Dr. Brett's blog (it is also listed in my blogroll under TraderFeed,) he gives a good summary on the sectors performance and many valuable trading development techniques. In this post, I will cover those sectors that Dr. Brett has summarized.

The tech has been one of the leaders throughout this rally. The XLK has been trending higher and the 50 SMA has crossed over the 200 SMA. As the second quarter coming to an end, lot of those skeptical fund managers that have been underweight in tech will dress up their portfolio with tech stocks before the end of the quarter. This window dressing will boost the tech ETF, XLK higher.


The financial has been strong until its recent consolidation. Similar to the tech sector, lot of people were skeptical about the financial sector. For those skeptics that have missed this rally, they are feeling they must move in during this consolidation to make up for their miss. Also, for those fund managers that have been invested in financial, they will increase their position on financial to dress up their portfolio with recent strong performers. After the XLF consolidated near the 200 SMA, the end of the quarter window dressing will move it above the 200 SMA and continue its upward trend toward the Nov 2008 high level.


With crude oil going from the $30's to over $70 a barrel, the energy sector has benefited from the crude oil rally. Looking at the energy ETF, XLE, it appears there remains some additional upside. Although the crude oil rally might be near the end, but the momentum on the energy stocks will continue for a bit longer due to window dressing and the anticipated pick up in demands due to the summer months.


Until recent increases in the long bond yields and the mortgage rates, the consumer sectors were performing quite nicely in anticipating the recovery is just around the corner. As this bear market rally make its final move, the momentum should carry over to these consumer sectors for some additional upside. The strength of this upside will depends on the perceived action or inaction on the interest rate by the Fed to combat the rising bond yield.


Momentum for the materials ETF, XLB might be slowing a bit, but the uptrend remains intact.


The industrial sector is similar to the consumer sectors. It is consolidating above the 200 SMA for support. Until signs of technical deterioration, uptrend remains intact to break above the Jan 2009 high.


Finally, the health care sector is gaining strengths as money rotate into this sector.


Share It

Sunday, June 7, 2009

Here Come That Big Sucking Sound

Can you hear that big sucking sound coming from all those that have missed this rally and those that been waiting for the pullback rushing in? It's like a vacuum that will suck all these skeptics into this final leg of the bear market rally.

From the following weekly charts, one can see the next leg of this rally is developing. In my previous post, I have put out some possible measured moves to be monitored as this final leg is being play out. I will not be shorting this market here. Yes, the fundamentals are still bad. But this rally is purely based on technicals, just like the crude oil. As a trader, it doesn't matter what the trend is based upon. You just go with the trend and do not fight the tape.


Share It

Friday, May 29, 2009

Are You Crazy?

Another week of chopping in the market. It appears we are locked in a trading range. But look what the weekly charts might be telling us. After you have read what I'm about to say, you probably will ask "Are you crazy?"

Don't get me wrong. I still believe this is a bear market rally. I don't try to forecast or predict what the market will do, or when it will do it. I simply listen to the market and interpret what it has to say, and then I formulate scenarios to deal with whichever direction the market decides to take. Sometime my interpretation could be completely incorrect. And I will be the first one to tell you that have happen more often than not. I have said it before, it is not about being right in calling the market, it is about being on the right side of the trade to make money. So here is what I'm seeing as a possibility. DJI to be above 10000, the SP500 in the 1150 range, and the Nasdaq 100 near 1600. "WHAT! Are you crazy?" You might think I got chopped by the market so badly that I start seeing things. No, the last couple of months I have been quite profitable...thank you very much. And no, I'm not crazy. Read on...

If the bull flag on the weekly chart for the DJI and the SP500 developed and played itself out, then the measured move put the DJI above 10000 and the SP500 at 1150. And the measured move from the double bottom on the Nasdaq 100 will put this index near the 1600 level if this rally is to be continued.

Is it possible for a bear market rally to make this kind of move? What is the reason for such a move to be possible? The reason for these indexes to reach these unthinkable levels (at the present time) will be the same reason for crude oil to reach $65 a barrel today. I don't need to tell you the answer, you know the answer. Go read what I said about crude oil prices from this post I wrote back in mid April of this year. Was the projected price I saw far fetch now? Who would have thought it could have reached $65 a barrel today.


Share It

Saturday, May 23, 2009

Still Chopping Around

I thought the bounce off the SP500 878 level would get things moving on the upside. As it turns out, the market simply refuse to go anywhere. The indexes have been chopping around the 8200, 875, 1360 for the DJI, SP500 and Nasdaq 100 respectively for more than 1 1/2 months.


But, things are getting interesting with the DJT. A down trend could be forming on this index. Not sure if it is due to the market finally realize the anticipated recovery is not coming soon or the crude oil prices moving above $60 a barrel due to weak US dollars caused the transport to weaken. My take is the market is starting to realize the economy is still far away from recovering. No matter what wimpy term, i.e. "geen shoot" these talking heads decide to propagate, things cannot be getting better if it is still less bad or going down less than before. To me, its not "green shoot" we are seeing, it is a "crap shoot" through all these bailouts, stimulus, and proposals various central banks, governments, and politicians are implementing and/or considering. So keep an eye on the DJT. It could be telling us something about what to come for the rest of the market (hint: Dow Theory).


Share It

Monday, May 18, 2009

Checking For Answers

The market moved higher today after last week's pullback. Is this the move that will give us an answer to which direction the market is heading in the near term? Let’s check the answer sheet.

The SP500 stayed above 875 and moved back above 900. The DJI also moved back above the 8400 level, and the Nasdaq 100 is back above its 200 SMA and above the 1380 level. Although trading volume is on the light side, I would say from the first check of the answer sheet, the direction is up.

The critical thing to watch is the trading volume. As the market continues to move up, trading volume needs to pick up. Otherwise, there will not be enough momentum to carry the market to the next resistance level. When we see volume increase, which will be the clue that money is coming back into the market, we should see some big move as skeptics rush back in. Until the market tells me otherwise, I will be on the long side.


Share It

Sunday, May 17, 2009

More Questions

Finally, the market has pulled back. The SP500 bounced off an intraday low of 878.94, less than four points from the 875 level many market participants were watching for test of support. Is this it for those that have been waiting for the dip to buy into this bear market rally? The Nasdaq 100 broke below its 200 SMA support. Will it climb back above the 200 SMA or dip down to find support at 1280 level? And the DJI went below the 8400 support. Will those last holdout skeptics and the buy-the-dip crowds finally get pulled into this rally and push the DJI up to the 9000 level? Lets see if the market will answer these questions next week.


Until the market has answered, I will continue to trade cautiously with reduced position size and tight stops.


Share It

Monday, May 11, 2009

Still Unresolved

After a week has gone by, the market still has not decided on which direction it is going to take in the near term. The DJI is still testing the 8400 level for support, and the SP500 is consolidating at the 910/920 level trying to decide whether to break above the trend line and move up to test the 200 SMA at the 950 level or pull back to the 870/880 range to test for support. The Nasdaq 100 broke through the 200 SMA and pull back to test it for support. It appears it is getting ready to move up to the 1470-1480 level if it hold above the 1380. Until the market has decided to move one way or the other, the direction for the market in the near term is still unresolved.


Share It

Tuesday, May 5, 2009

Waiting Again

Here we are waiting for the market to decide which direction it wants to move after the SP500 broke above the 875 level. Yesterday, the first session after the SP500 closed above the 875 level, the market displayed strengths on the opening hour and the last trading hour. Then today, the market really did not do much other than give back a small portion of yesterday’s gains. Even that was not very eventful, as the closing minutes was near, the market rallied back to recoup majority of the trading session losses.

Looking at the candlestick chart for the DJIA, SP500, and the Nasdaq 100, one can see today’s price actions from all three indices formed a doji type of candle. This type of candle appears when there is indecision amongst the buyers and the sellers (bulls & bears), and it is a prelude to a new trend, may it be up or down. Rather than try to guess which way the market will be headed, I will take the sideline and wait for the market to make its move then trade accordingly. There is lot of jittered bulls feeling the market is extended and simply looking for an excuse to take profits. Then there are those that felt the SP500 closed above 875 and into the 900 level shows the market have more upside to go. Like any good student of the market, I have mapped out the scenario for the upside and the downside. Therefore, whichever direction the market decides to take, I will be ready.

The scenario I have for the DJI on the upside is moving into the range between 8900-9100, nearing the 200 SMA. On the downside, if the market decided to pullback and consolidate, it could pull the DJI back to the 7500-7750 area after a minor test of support at 8000.


For the SP500 on the upside, the next probable resistance level is 920/940. On the downside, if it does not hold above 875, it could retrace back down to the 800 level.


Finally, the upside for the Nasdaq 100 is 1470 near the 1500 level. There could be a minor test of support at 1380 before it breakout on the upside or the downside. If the Nasdaq moves below 1380, then it probably will not find support until it reaches the 1280 or the 1140 level.


These are the possible upside and downside scenarios I will be watching in the coming days. No matter which way the market decides to move, the next move will be dramatic. So prepare for some volatility.


Share It

Monday, May 4, 2009

How Long Can This Last?

Last Friday, the SP500 closed above the 875 resistance level and today the market surged ahead toward the next potential resistance level. Rather than repeating those levels here, I will refer you to go review these post, "To Be Continued.." and "Everyone Is Watching" for the resistance levels.

This bear market rally has defied many skeptics, and even the believers are now questioning how long this rally can last without a serious pullback. The longer this market continues to move higher, the riskier it gets for both the bulls and the bears. The rally is now entering into its eighth weeks. Being so extended, it is simply too risky to open new longs (unless you are day trading) and too early to go short. Under this condition, I would rather miss a few hundred points rally on the Dow than getting bull trapped. Like the musical chairs analogy I used in my previous post, it's not a matter of 'if' the music stops; it is a matter of 'when' the music stops. We all know a pullback is forth coming, we just don't know when and how extensive it will be.

Here are how the charts look like after today's rally:


Share It

Friday, May 1, 2009

Here We Go Again

If the market doesn't involve money, some of the things it does will be outright amusing. But since it is all about money, one must be alert to some of the things the market does in order to avoid being caught on the wrong side. Here is one of those things that will make you pay if you are not alert of its happening.

Today the SP500 finally closed above the 875 level that so many market participants and talking heads have been waiting for. During the last couple trading sessions, the market has been testing the 875 level many times, and one can sense the jitters and the rattled nerves when the market approach the 875 level. The price actions have been like a game of musical chairs. All the players in the game know the music will eventually stop. Some of the players are so nerve wrecked, they try to anticipate the stopping of the music by sitting down before the music actually stop. After they sat down and realized the music hasn't stopped yet, they get back up and follow the rest of the crowd until another nerve gets wrecked, and this process repeat itself until the music finally stop.

The price actions on Thursday, April 30, 2009 trading session is like a game of musical chairs with a bunch of nervous players. The market move above the 875 and some players decided to sell to avoid ending up holding the bag when the market sell off. After they sold, they realized the market is not ready to sell off, so they join back in with the rest of the crowd and push the market back above the 875. This process was repeated multiple times throughout the session.

Today, May 1, 2009, the music stopped. Five minutes before the close, SP500 was struggling to close with a modest gain at 873, then a last minute push was made to push the SP500 to close at 877.52. This last minute push to help the SP500 closed above the 875 level reminded me what took place on January 30, 2009 when a last minute push was made to prevent the DJI from closing below the psychological support level of 8000. We all know what followed after this artificially support was made for the DJI 8000 level.

So, here we go again. The market removed a question mark for the skeptics to enter the market by closing above the 875 level. How much conviction is behind this close above 875 on the SP500 will be revealed in the coming week. Is it a breakout or a head fake. If it is anything like the January 30, 2009 efforts to hold the DJI above 8000, then get ready for a wild ride down.

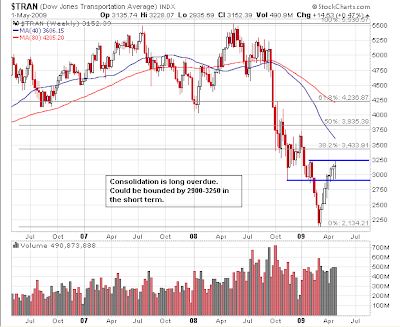
Since there hasn't been any dramatic changes in the daily charts, I have decided to put up the weekly chart to get a different perspective on the price levels. Here is the SP500 weekly chart:


The DJI weekly chart:


The DJT weekly chart:


The Nasdaq 100 weekly chart:


The Russell 2000 weekly chart:


The weekly charts show how these widely watched indices have been positive for multiple consecutive weeks. The market is definitely over extended, and with the SP500 finally closed above the 875 resistance level, it won't be long before the long awaited pullback to occur. When the pullback arrives, will it be a pullback or a reversal. While I'm waiting for the market to show its move, I will be managing my opened long positions with very tight stops and preparing to take the short side if the market decided to reverse.

Keep a close watch on the market next week and trade cautiously. Be on the lookout for increasing volatilities.


Share It

Thursday, April 30, 2009

Gold, Gold, Gone

I do not disagree with the premises of higher gold prices in the long term due to the enormous liquidity injection from the Fed. But as a trader, one must trade according to the near term trend. The near term trend for gold is down, and therefore I am bearish on gold in the near term. As the chart below shows gold most likely will not see major support until it reached the 835 level, or even down to the 800 level. When fears return to the equity market, gold could become a safe haven play again and that might give some near term price supports. But in order for the price of gold to move above the 1000 mark and beyond, the inflation picture has to come into play. Inflation will not return until the recession has ended and the recovery phase is well underway. From the latest statistics, the contraction of the US economy has slowed, but the contraction has not stopped. This imply the recession has not ended.


Share It