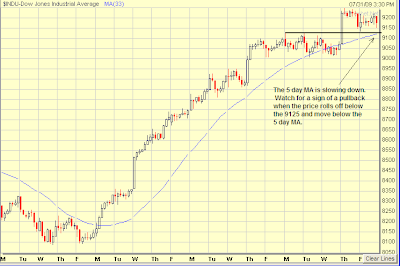
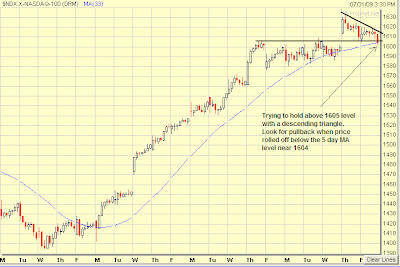
One of the common characteristic from these intraday charts is the slowing rise of the 5 day MA. In addition, prices are coming down to test for the 5 day MA for support. If the price rollover and goes below the 5 day MA, then the next sign for conforming a pullback is in progress is when the 5 day MA starts to rollover.
For the indices, here are the support levels I am watching, 9125 for the DJIA, 982 for the SP500, 1605 for the NASDAQ 100. If these levels are violated on the downside, be on the lookout for a pullback.


For the index ETF, DIA, SPY, and the QQQQ, here are the support level to watch, 91.27 for the DIA, 98.38 for the SPY, and 39.50 for the QQQQ.


