The SP500 not only broke the 2056.15 support level, it also broke the 2040.24 level today. More importantly, it closed at a new post record high low and removed itself from being diverging from the DJI. It closed at 2035.73, down -43.88 or -2.11%. The nearest potential support is the 2/2-2/3/15 price gap at 2020.85 that is in confluence with the -161% Fibonacci extension from the ‘H’ pattern. If this 2020.85 fails to provide support, then the 12/16/14 close near 1972.56 is the next potential support. The 2040.24 level that was support is now the potential resistance with 2056.15 as the next higher level of resistance.
SPX

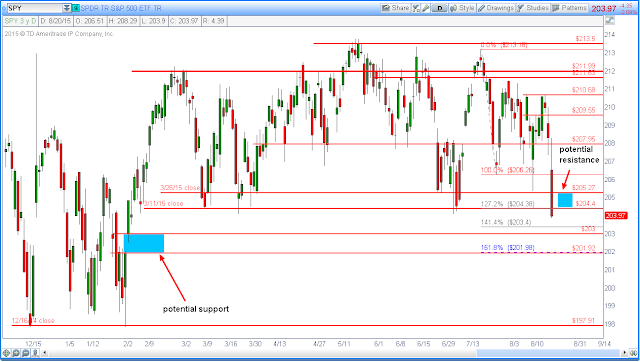
The SPY broke the 204.40 support. The price gap on 2/3/15 is now the potential support area and the previous supports at 204.40 and 205.27 are now the potential resistance levels.
SPY

The Nasdaq 100 got beat up today. The last time the NDX had dropped more than 100 points was on 3/25/15. Today, it closed with a drop of -125.77 or -2.79% at 4385.13. Not only it had filled the price gap, it also came near the 4379.75 support level. After today’s decline, the support zone between 4379.75 and 4349.93 is now the potential support area, and the 4456.54 is the potential resistance.
NDX

The Russell 2000 was the second worst performer today, following the Nasdaq 100. It closed at 1172.52 with a loss of -30.46 or -2.53%. It had more than filled the 2/3/15 price gap. The potential support level is 1154.71 with the price gap upper level at 1180.06 as resistance.
RUT

In earlier posts, the observed divergence amongst indexes and the mixed messages from some of the breadth indicators were discussed. Today, the market has given us some clarifications on those observations. The SP500, Nasdaq 100 and the Russell 2000 closed with a new post high low along with the DJ Industrial closing low today, and this has eliminated the divergence. The breadth indicators still sending mixed messages. One should continue to monitor for clarifications. The DJ Transportation was down more than 200 points, but it still closed above its recent low. Therefore, the DJ Industrial did not receive a confirmed Dow Theory low today.
As one can see, the market is approaching some critical levels with mixed messages. This is typically the case when the market is about to make a decisive move. Until the market has decided which direction it will move, one should remain cautious and remind oneself that ‘cash is a position.’