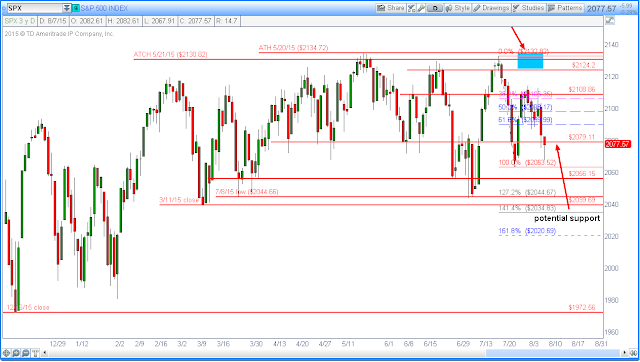
The SP500 ended the week below the support level of 2079.11. It closed at 2077.57, down -5.99 or -0.29% on Friday. It did manage to regain more than half of its earlier losses and closed with a bearish hammer candle. Although it is couple of points below the 2079, essentially it is still sitting at or near the 2079 support level. Based on the price action from last Friday, an oversold rally could appear next week and push it back above the 2079 level and put the 2108.86 resistance back in play. If the oversold rally does not appear or the price falls below 2063.52, then the Fibonacci -127% extension at 2044.67, which is in confluent with the 7/8/15 low could be the near term potential support.
SPX
(click on the chart to enlarge)

In term of the SPY, it closed at the 4/17/15 close of 207.95. This level could remain to be the support until it is broken. If the price falls below 206.26, then the Fibonacci -127% extension at 204.38, which is in confluent with the 7/8/15 close could be the next potential support.
SPY

The Nasdaq 100 closed the week at 4520.08. On Friday, it’d loss -8.43 or -0/19%. It did manage to recoup most of its losses and printed a doji candle with a long lower wick. This doji candle could imply the buyers came back in at the end of the session and this index could rebound back toward the resistance zone between 4546 and 4562. If it fails to hold the near term support at 4506, then the price gap between the -127% and -141% extension of the Fibonacci retracement could be in play.
NDX

On Friday, the Russell 2000 came down and tested the 1/26/15 close near the 1200.74. It also rebounded in mid Friday afternoon and recouped most of the session’s earlier losses. It closed at 1206.90, a loss of -8.95 or -0.74%. The 1238.76 remains to be the near term resistance while the 1215.42 could be the potential short term resistance. If it breaks below the 1/26/15 close at 1200.74, then the 2/3/15 price gap between 1175.56 and 1180.06, which is near the -168% Fibonacci extension could be in play.
RUT

The market breadth remains to be weak. Any rally should be met with suspicions. Present market environment still favoring the short term traders. As a reminder, cash is a position.