Sunday, December 19, 2010

Unbelievable

As 2010 coming to an end, the market continues to move higher. If I were ask to describe 2010 in one word, the word would be “unbelievable.”

It is unbelievable for the Nasdaq 100 to move beyond the 2008 high and is approaching the 2007 high while the U.S. unemployment rate at 9.8%. It is unbelievable the SP500 and the DJIA are making multi-years high while the U.S. deficit and its debt are in multi-trillion dollars level. But let’s not forget, the market is a leading indicator and the high the market is making is not reflective of what was and what is, instead it is signaling on what to come. Already this holiday retail sales has being revised upward with a projection it will increase 3.3% over last year’s holiday sales, and the consumer sentiments are improving, and the latest tax extension bill passed by the congress and signed by the President remove many uncertainties for businesses and taxpayers. All of these positive developments can only lead to a stronger U.S. economy, and that is a good thing. I believe the market is telling us better days are approaching, 2011 will be a better year for the U.S. economy, and just maybe it will be the end of the deepest recession since the depression.

Have a happy holidays.

SP500:


DJIA:


Nasdaq 100 (daily):


Nasdaq 100 (weekly):
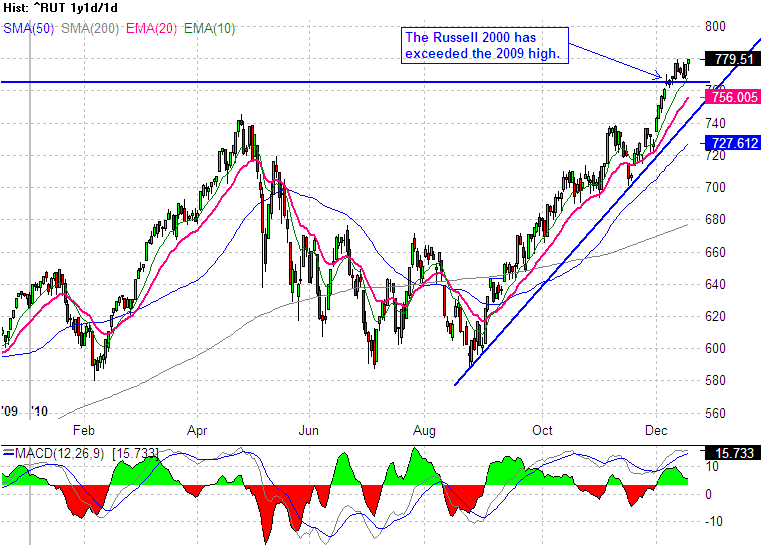


Russell 2000:


Share It

Monday, November 29, 2010

One Last Shake

The market rarely fail to shake out the weak before it moves higher. Today the SP500 went down double digit to shake out the weak before it rally back toward positive territory in late afternoon trading, and closed at 1187.76(down 1.64 points.)

In the SP500 daily chart below, it shows how the intraday broke below the 50 SMA to spook those traders that were looking for support from the 50 SMA. After it broke and shake out those traders, the SP500 reversed and printed a doji hammer candle with a long shadow along with the low holding above the previous low of 1173 by $0.64 (subtle?). This could be the last shake out before the year-end rally get started. Happy holidays!

SP500:


Share It

Saturday, November 27, 2010

Gathering Momentum

After spending couple weeks consolidating, the market is gathering momentum for a year-end rally. The SP500, Nasdaq 100 and the DJIA all held support near or above their 50 SMA and built a nice small base. When the year-end rally kicks in, the major market indices will likely break above their recent high.

Here are the charts for the market indices:

SP500:


Nasdaq 100:


DJIA:


Share It

Tuesday, November 16, 2010

Entered The Pull Back Zone

The SP500 has experienced four consecutive down days, and today it has entered the pull back zone between 1600 and 1800. The critical level for the SP500 and other major market indices in the near term will be their 50 SMA. If the SP500 does not find support near its 50 SMA, then there is a high probability it will retrace back to the 1125 to 1130 level (which is also near its 200 SMA).

The financial EFT, XLF has penetrated its 50 SMA intraday today, and the technology ETF, XLK is closing in on its 50 SMA. If the financial and the technology sector unable to find support near their 50 SMA, then most likely the SP500 will decline to the 1125-1130 to test for support.

One positive catalyst for the market this week is GM’s IPO. From the latest indication, the pricing of GM IPO will be above the initial price of 26-29 due to high demand for the shares. The debut of this IPO could provide some positive sentiments to the market on Thursday.

Although the SP500 is down more than 19 points or 1.6% today, but things appear to be stabilizing and/or turning around near the close. I will not be surprise to see some sort of short term oversold rally tomorrow. As far as trading goes, I will remain patient and wait until support has been established for this pull back before opening any new long positions. In the meantime, I will continue to do quick trades with reduced size (no holding period of more than 2 days).

SP500:


XLK:


XLF:


Share It

Sunday, November 14, 2010

1st Round Goes To Fibonacci

It appears the SP500 has found resistance at the 61.8% Fibonacci retracement level, and the first round goes to the Fibonacci traders while the pattern traders have to wait for their Head & Shoulder measured move to materialize.

Prior to the Fed's QE2 announcement, the tech sector has been leading the market up and the financial was in dormant. After the Fed announced its QE2 plan, the financial woke up and moved some of the skeptics into the market and this surge have triggered some profit taking. Since next week being an OpEx (option expiration) week, further shakeout with increasing volatility can be expected.

The market has not given any sign of a top, and the likely support from this pullback will be near the 50 SMA level (see the charts below). Until a support level has been established, buying the dip (bottom fishing) can be a risky move. I will be keeping a close watch on the 50 SMA for clues on whether the market will be resuming its rise or more pullbacks to come.


SP500:


XLF:


XLK:


Share It

Sunday, November 7, 2010

The Chase Is On

After the conclusion of the U.S. midterm election, the Fed’s QE2 announcement, and the U.S. Job Report, the market continue to surge higher with the SP500 hitting the 1220 target level.

From the recent price actions, one can detect there are traders chasing after rising equity prices. Although there are no signs of a market top, but the SP500 is approaching an important inflection point near the 1230-1250 level.

The following SP500 price charts illustrate how the 1230-1250 inflection level was derived. In the first SP500 weekly price chart, it illustrates how the inverted head & shoulder pattern formed between 10/08 - 7/09 gave a measured move of approximate 1250. The second SP500 weekly price chart shows the 61.8% Fib retracement between the 2007 high to 2009 low place it at 1228.74. The significance of these levels is purely technical and these levels have the potential to be resistance and could potentially be reversal level. If the SP500 can hold above the 61.8% Fib retracement level, there is a high probability that it will retrace back to the 100% level, which will place the SP500 back to the high of 2007.

I will not be surprise to see the SP500 reach the 1250 level before it consolidates. The reason is 1250 level have been mentioned by different talking heads as the high for the SP500 in 2010 or the SP500 will end 2010 at 1250. Since the 1230-1250 is in sight for the SP500 to hit, probability favor it will be hit.


Share It

Sunday, October 31, 2010

Shake & Bake

The SP500 has been stuck in the range between 1170-1185 for the last couple of weeks while the Nasdaq broke to a multi-years high. The tech sector has been carrying the weight for the SP500 while the financial have been struggling. Looking at the price actions of many stocks from different sectors, it appears the market is ready for some shake and bake with the climatic conclusion of the mid-term election and the Fed’s QE2 announcement.

My stance is no matter what the outcome is from next week’s activities, the market is biased to head higher after the shaking is completed and 1220 level is still the upside target for the SP500. Until the dust is settled from all the catalysts that been brewing (pricing) in the market, I will continue to focus on short term trades with reduced size.

Here are the charts for the SP500, DJIA, and Nasdaq 100:

SP500:


Nasdaq 100:


DJIA:


Share It

Monday, October 11, 2010

Slowing Down

After the SP500 busted through the 1150 level, momentum appears to be slowing down as the major indices getting near potential resistance. Being this is an options expiration week, things can get dicey.

The following charts for the SP500, Nasdaq 100 and the DJIA show how these indices are bumping up against trend line resistance with declining momentum highlighted by the MACD histogram. Presently, there is no clear indication the market is reversing. Since the market has not shown any sign it has reversed, it would not be wise to go short at this time. In the meantime, I will be tightening up the stops for the longs to lock in profits and/or to preserve capitals. I am not eager to establish new long positions until the approaching resistance has been broken and tested.

Notice the price channels drawn in the following charts. If these price channels hold, then the likelihood of a near term reversal is high as the indices retrace from the resistance level.


SP500:


DJIA:


Nasdaq 100:


Share It

Tuesday, October 5, 2010

Rally On!

After spending the last week consolidating some of the recent gains, the market resume it move to higher high. Today, broad market participation help pushed the SP500 through the 1150 level and closed at 1160.75, and the DJIA closed at 10944.70 after it has come near the 11,000 level. More importantly, the Russell 2000 along with the DJ Transportation index finally join the rally by breaking above their June/July high today.

To be honest, today's move did catch me a bit off guard. I was expecting this rally to resume after additional pull back. But the market don't care what I expect, it move when it is ready to move. I am not one of those that trying to be right in calling the market, I'm just trying to be on the right side of the trade to make some money from the market. So when the market say "Rally on!" I'm in.

A lot of market participants are still skeptical of this rally. When the SP500 explode passed the 1170 level, these skeptics will rush in to catch this moving train. The price actions are saying this market is moving higher, don't let those nay-sayers deter you from trading this rally. October will be October, and I will long this market until the price actions tell me its time to take the money and run. Of course, always manage the risk. So rally on!

SP500:


Nasdaq 100:


DJIA:


DJ Trans:


Russell 2000:


Share It

Saturday, September 25, 2010

Finishing The Week With A Bang

What a week! The SP500 broke through the trading range on Monday, then it spend the next three trading sessions pulling back to test the breakout. On Friday, the market opened with a bang and the SP500 immediately went back above the upper level of the trading range. It spent most of Friday's trading session attempting to break above Tuesday's intraday high of 1148. As the third quarter coming to an end, the window dressing activities will most likely push the SP500 to the 1170 level.

Here is a 30 minutes intraday chart highlight this week's SP500 moves:


and here is the daily SP500 chart showing the next target level:


Share It

Monday, September 20, 2010

Finally!

After being trapped in a trading range between 1040-1130 for months, the SP500 finally broke above the trading range and closed at 1142.71 today. Joining the break are the Nasdaq 100 & the DJIA. Still lagging behind are the Russell 2000 and the DJT. Today's move will likely continue with further move toward the next target level (see charts.)

SP500:


DJIA:


Nasdaq 100:


DJT:


Russell 2000:


Share It

Wednesday, September 15, 2010

Getting Close

The SP500 is getting close to the 1130 level after holding above the downward trendline. Today, the Nasdaq 100 intraday high of 1942.34 exceeded the June 21, 2010 intraday high of 1939.77 and closed near the 1940 mark at 1936.60.

After today's market actions, it appears the SP500 will likely assault and move above the 1130 level. How sustainable this rally will be is depended on how quickly the Russell 2000 catches up with the SP500 & the Nasdaq 100. If the Russell 2000 continue to lag, then the extend of this rally could be limited. In the meantime, the momentum is on the up side and I will be selective long.

Here are the charts. Click on them to get a larger image and to read the embedded comments.

SP500:


DJIA:


Nasdaq 100:


Russell 2000:


Share It

Thursday, September 9, 2010

Upward Bound

It looks like the market is making a move toward the upper level of the trading range. The SP500 and the Nasdaq 100 downward trendline that I have mentioned in my last post are being violated. If these two indices can hold above the trendline, then the upper range of their respective trading range will likely be the next target, i.e. 1130 for the SP500, 1940 for the Nasdaq 100.

SP500:


Nasdaq 100:


Share It

Tuesday, September 7, 2010

Still In The Range

The market has been choppy and it has not changed much. It is still trapped in a trading range. The SP500 is still in the 1040-1130 trading range. Until it breaks out of this range, the market will continue to be choppy and favor the short term traders.

Here is the latest SP500 chart showing a newly formed bearish trendline. This trendline along with the 1040 support trendline is forming a descending wedge pattern. This descending wedge added importance to the 1040 support level. If the SP500 goes below 1040, the bears will likely hit the market hard on this break.

SP500:


Share It

Wednesday, August 25, 2010

Where Will It Stop

After four consecutive down days, the market finally finished in an up day with the SP500 bouncing off the 1040 level, the DJIA bounced off the 10,000 level after it has briefly went below 10,000 during intraday, the DJT bounced off near the 4000 level, the Russell 2000 bounced off near the 590 level, and the Nasdaq 100 bounced off near the 1750 level. With all these market indices bouncing off their intermediate support, does it mean this downward trend has reached its end?

Looking at the technical, today's rally is no more than an oversold rally. I do not believe these support levels will hold. The momentum appears to indicate the market is destine to fall to their June/July 2009 low. In the coming days, the market could continue to rally due to short covering and some short squeeze. After some of the shorts have been taken out, the downtrend will likely resume. In the meantime, I will continue to treat this market as a trader's market with a downside bias.

SP500:


DJIA:


DJT:


Nasdaq 100:


Russell 2000:


Share It

Tuesday, August 17, 2010

Still Trapped

It has been two weeks since I last posted and the market has not broken out in neither direction; up or down. The SP500 along with many of the market indices are still trapped in a trading range. Although the technical indicators are in a slight negative bias, I will continue to take quick trades with reduced size until the SP500 either breaks above the 1130 level or breaks below the 1040 level.

SP500:


Russell 2000:


Share It