In this Trading The Price, we will review the precious metals/gold mining stocks, and analyze them for trade setup using technical analysis technique.
Click here to view the video.
Showing posts with label ABX. Show all posts
Showing posts with label ABX. Show all posts
Saturday, January 13, 2018
Monday, September 4, 2017
Stock Market Update - 9/4/2017
In this stock market update, we will review the stock market indexes, and analyze stocks for trade setup using technical analysis technique.
Stock analyzed: AAPL, FB, NFLX, AMZN, GOOGL, SPY, QQQ, IWM, GLD, GDX, GDXJ, ABX
Click here to view the video.
Stock analyzed: AAPL, FB, NFLX, AMZN, GOOGL, SPY, QQQ, IWM, GLD, GDX, GDXJ, ABX
Click here to view the video.
Share It
Tweet

Monday, August 28, 2017
Gold Next Price Target: $1400
Gold has broken out and closed above the 1300 level today. If the price of gold continue to move higher, then $1400 could be the nearest potential price target.
In this video, we will take a look at gold and it's EFT, GLD. In addition, we will also review the following gold related ETFs and stocks: GDX, GDXJ, NUGT, JNUG, ABX, AU, AUY, NEM.
Click here to view the video.
In this video, we will take a look at gold and it's EFT, GLD. In addition, we will also review the following gold related ETFs and stocks: GDX, GDXJ, NUGT, JNUG, ABX, AU, AUY, NEM.
Click here to view the video.
Share It
Tweet
Tuesday, December 8, 2015
Gold Miners Updates
Here are the updates for the miners that were discussed in this post "Gold Miners" for possible swing long. Click on the chart to enlarge the image to read the commentary.
Share It
Tweet
Thursday, December 3, 2015
Gold Miners
Recent low made by some of the gold miner stocks could be setting up for a bounce back toward previous pivot high. Here are a few of these mining stocks.
Share It
Tweet
Monday, January 12, 2015
Sunday, January 4, 2015
Prepping For 2015
Happy New Year everyone! Hope everyone had a great 2014 and wish everyone a profitable 2015.
In this video, we will take a look at the market's recent price actions and what to monitor, then review some of the recent swing long setup for DDD and some of the gold miners, and finally review the following momo stocks: AAPL, BABA, NFLX, FB, TWTR, TSLA, AMZN, GOOGL. The mining stocks covered in this video are: NUGT, GDXJ, ABX, AU, AUY.
In this video, we will take a look at the market's recent price actions and what to monitor, then review some of the recent swing long setup for DDD and some of the gold miners, and finally review the following momo stocks: AAPL, BABA, NFLX, FB, TWTR, TSLA, AMZN, GOOGL. The mining stocks covered in this video are: NUGT, GDXJ, ABX, AU, AUY.
Share It
Tweet
Wednesday, December 31, 2014
Live Video Update - 12/31/2014
Hope you had a great 2014. This is my last video for 2014. In this live video, I will review the recent swing long trade setups and a look at these MOMO stocks: AAPL, FB, NFLX, TSLA, AMZN & GOOL, along with TWTR, BABA, CYBR, NUGT, GDXJ, ABX, AU, AUY.
Happy New Year!
Happy New Year!
Share It
Tweet
Tuesday, December 30, 2014
Gold Miners Trade Setup
Here are some potential swing long setups for some gold miners and a few of the miners' ETF. The red dash line is a reference level for establishing stop loss, the black dash line is the trigger level and the blue line is the initial potential target.
Share It
Tweet
Sunday, February 23, 2014
Gold And 3D Printers - 2/23/2014
The precious metals have been rallying from their recent bottom, and they appear to be setting up for further upside. The 3D printer segment got hit fairly hard during the recent pull back and now it appears to be making a comeback.
Share It
Tweet
Sunday, June 16, 2013
Golden Moment Again?
From the recent price actions in gold, silver and some of the mining stocks, it appears the precious metals might be setting up for a bounce after the recent turbulent drop.
Here is a video reviewing the recent price actions and some of the possible upside price targets and breakout levels.
Here is a video reviewing the recent price actions and some of the possible upside price targets and breakout levels.
Share It
Tweet
Tuesday, March 10, 2009
The Rally Everyone Waited For
The rally everyone waited for finally arrived. This has to be one of the most anticipated rally in recent days. Every financial news network, financial program, and talking head are saying how the market is oversold and a relief rally is imminent. I was a bit surprise that it actually occur when such high level of anticipation existed. Normally, the market does not do what is expected. Since it is here, this rally is quite different than the one from last Friday, March 6, 2009. There are much more convictions in today's rally. The advance/decline ratio is more than 10 to 1, and the up/down volume ratio is greater than 20 to 1 in the NYSE. The Nasdaq advance/decline ratio is 5 to 1, and up/down volume ratio is nearly 20 to 1. DJI closed up 379.44, SP500 closed up 43.07, and Nasdaq 100 closed up 68.57.
In order for this rally to be more than a single day event, it needs to demonstrate some sustaining powers by following through with a few more up days and possibly move the DJI back up to test the support it had broken in the 7500 level, and the SP500 back up to test the 750 level. And maybe during this bear market relief rally, some market internals will be strenghten for the market to make a bottom on its next downward move. Lets not lose sight that the bear market is still in force, and a lower low for the DJI is still to come. So let make some money on the longs from this bear market rally while it last, and keep a watchful eye on the market to see if it can put in a bottom in the latter part of March or in the month of April. If a bottom is not made within this time frame, then it will be a long tough year for the economy and a recovery in 2009 will just be a dream.
Here are the charts for the indexes with my commentary embedded, click on the image to get a larger view:


There were two weaknesses today and they were the crude oil and gold. Crude pulled back a bit from its recent run up, but that did not discourage the big oil companies from participating in today's stock market rally.


Gold fell back to under $900 an ounce and exhibited a failed bull flag pattern. The bull flag pattern failure can turn into a bear flag if it break below the trendline support. In the short term, if a position is establish either on the long or the short side, tight stop must be exercise since it is at an inflection point that it can reverse just as quick as it breaks down. But I do share the longer term view that gold will rally back up to test and break the 1000 level before the bull move is over. For now, direction is unclear. Need more confirmations on its intended direction.


In order for this rally to be more than a single day event, it needs to demonstrate some sustaining powers by following through with a few more up days and possibly move the DJI back up to test the support it had broken in the 7500 level, and the SP500 back up to test the 750 level. And maybe during this bear market relief rally, some market internals will be strenghten for the market to make a bottom on its next downward move. Lets not lose sight that the bear market is still in force, and a lower low for the DJI is still to come. So let make some money on the longs from this bear market rally while it last, and keep a watchful eye on the market to see if it can put in a bottom in the latter part of March or in the month of April. If a bottom is not made within this time frame, then it will be a long tough year for the economy and a recovery in 2009 will just be a dream.
Here are the charts for the indexes with my commentary embedded, click on the image to get a larger view:


There were two weaknesses today and they were the crude oil and gold. Crude pulled back a bit from its recent run up, but that did not discourage the big oil companies from participating in today's stock market rally.


Gold fell back to under $900 an ounce and exhibited a failed bull flag pattern. The bull flag pattern failure can turn into a bear flag if it break below the trendline support. In the short term, if a position is establish either on the long or the short side, tight stop must be exercise since it is at an inflection point that it can reverse just as quick as it breaks down. But I do share the longer term view that gold will rally back up to test and break the 1000 level before the bull move is over. For now, direction is unclear. Need more confirmations on its intended direction.


Share It
Tweet
Sunday, March 1, 2009
I'm Still Waiting
The Dow and the SP500 closed at another new low. The DJT continue to make new low and signaling lower low for the DJI. The SP500 closed below the April 11, 1997 low of 737.65 and the DJI is still more than 600 points away from its April 11, 1997 low of 6391.69. Strangely enough, the Nasdaq 100 and the Russell 2000 are still holding above their Nov. 20, 2008 low, but they are drifting toward that mark. With the market going down to a level made more than 10 years ago, one would think gold will be more than $1000 an ounce. Instead, gold has been consolidating from its recent high. It has pulled back below the $1000 mark and has been bouncing around the 970-930 level. Even some of the mining stocks have pulled back from its recent high and testing major support level. What do all these mean?
With the VIX below 50, there is just not enough fear in the market for gold to play its safe haven role. I believe when the DJI break below the 7000 level with increasing uncertainties in the financial system, fears will return and gold will resume its rise to $1000 an ounce and beyond.
The chart on the future contract for gold shows the price for an ounce of gold has pulled back to the 925 support level. If it break this level, then the next key support will be the 50 SMA around the 900 level. These are the key levels to monitor for the future direction in gold.

Similar for the gold ETF, GLD.

In order for gold to continue its rise, it must hold these support levels. For the gold mining stocks, the picture is mixed. When gold went above its July 2008 high, the mining stocks was unable to get close to their July 2008 level. The mining stocks EFT, GDX shows it has pulled back to the trendline and the 50 SMA after reaching its September 2008 level. Furthermore, it has formed an ascending triangle pattern with a possible breakout level of 37.50 on the upside and 32.50 on the downside.

ABX has the most unsettling pullback. It has closed below its January 2009 low with the 50 SMA turning down once again. If this stock break below 30, then GDX will likely to break below the 32.50.

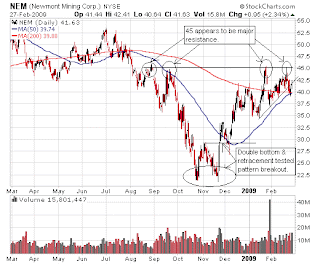
The GG and NEM show a similar price pattern as the GDX.

While the market is trying to find the bottom and gold is getting ready for the next move up, I'm still waiting for them to set up for my next trade to go long on DXD and GLD.
With the VIX below 50, there is just not enough fear in the market for gold to play its safe haven role. I believe when the DJI break below the 7000 level with increasing uncertainties in the financial system, fears will return and gold will resume its rise to $1000 an ounce and beyond.
The chart on the future contract for gold shows the price for an ounce of gold has pulled back to the 925 support level. If it break this level, then the next key support will be the 50 SMA around the 900 level. These are the key levels to monitor for the future direction in gold.

Similar for the gold ETF, GLD.

In order for gold to continue its rise, it must hold these support levels. For the gold mining stocks, the picture is mixed. When gold went above its July 2008 high, the mining stocks was unable to get close to their July 2008 level. The mining stocks EFT, GDX shows it has pulled back to the trendline and the 50 SMA after reaching its September 2008 level. Furthermore, it has formed an ascending triangle pattern with a possible breakout level of 37.50 on the upside and 32.50 on the downside.

ABX has the most unsettling pullback. It has closed below its January 2009 low with the 50 SMA turning down once again. If this stock break below 30, then GDX will likely to break below the 32.50.

The GG and NEM show a similar price pattern as the GDX.


While the market is trying to find the bottom and gold is getting ready for the next move up, I'm still waiting for them to set up for my next trade to go long on DXD and GLD.
Share It
Tweet
Sunday, February 1, 2009
The Golden Moment
 On January 24, 2009, I put up a post saying "Here comes the gold." On the following Monday, a spike in GLD (the gold ETF) price occurred and indicated there was increased new interest in gold from the sideline (click on the chart on the left for a larger image). Those that got in at the low 80s level were waiting for this golden moment to take some profits. As the price retreated back to the breakout level, those that missed getting on board saw it as a second chance for them to get in. Now gold has caught the attention of many in the financial press, more sideline money will be coming in to help push it above the $1000 level, and the ETF GLD will likely break the July, 2008 resistance level.
While gold was up more than $20 last Friday, the gold mining stocks retreated from their opening high and ended the session by giving up some of the recent gains. This warrant some careful monitoring to make sure the divergence between the gold mining stocks and the precious metal itself does not continue for too long.
 It can be that people are just more incline to own the actual gold than the gold mining companies. If this turn out to be the case, then the run for the hill on gold will be very sharp and quick. From the ABX chart, one can see how the price retreated on Friday from its opening high (big solid weak candle).
For those that are interested in gold mining stocks, an alternative to picking gold mining companies is to play the ETF GDX. This is an ETF that track a group of mining companies.

I hope you will have your golden moment from the bull move on gold. Trade well, trade profitably, and don't get greedy.
Share It
Tweet
Saturday, January 24, 2009
Here Comes The Gold
Gold has been quietly making its way back to the $900 an ounce level and the ETF, GLD is breaking out.

The GLD gapped up and broken out of the triangle pattern on Friday with heavy volume. It also broke above the December 2008 triple top decisively. Next level of resistance will most likely be in the 91-92 zone. We'll see if gold will hit the $1000 mark next week. If it does, that will move lot of the sideline money and the money sitting in treasury into gold.
A related gold mining stock is of interest as well, ABX.

The price action on this stock is very similar to the GLD ETF. It broke above the December 2008 resistance and testing the next level resistance between 39 and 40. When it breaks above 40 and when gold move above the $1000 and toward the $1200 per ounce level, this stock could be looking at making a new all time high above 52.
Keep an eye on gold and gold mining stocks for the next bull move.

The GLD gapped up and broken out of the triangle pattern on Friday with heavy volume. It also broke above the December 2008 triple top decisively. Next level of resistance will most likely be in the 91-92 zone. We'll see if gold will hit the $1000 mark next week. If it does, that will move lot of the sideline money and the money sitting in treasury into gold.
A related gold mining stock is of interest as well, ABX.

The price action on this stock is very similar to the GLD ETF. It broke above the December 2008 resistance and testing the next level resistance between 39 and 40. When it breaks above 40 and when gold move above the $1000 and toward the $1200 per ounce level, this stock could be looking at making a new all time high above 52.
Keep an eye on gold and gold mining stocks for the next bull move.
Share It
Tweet
Subscribe to:
Posts (Atom)