Sunday, January 31, 2010

Payback Time

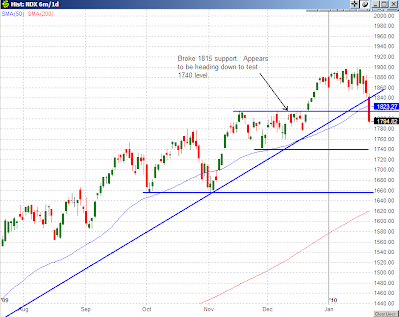
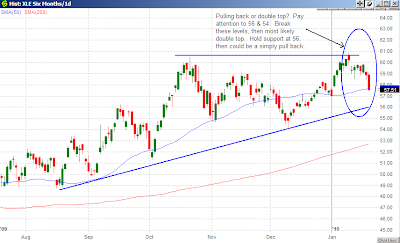
It appears the bears are in control now, and the price actions are a mirror image of the time when the bulls have control of the market. Major indices failed to hold the current support level and the bears took it down decisively. For those that been buying into this dip is probably feeling it now. Click on the following charts to view where the next possible support level might be and to read the commentary. The bias remains to be bearish. Buying here could be like catching a falling knife.

DJIA:


SPX:


NDX:


RUT:


XLE:


XLK:


XLF:


Share It

Thursday, January 28, 2010

Critical Juncture

The market has reached a critical juncture where it must establish support near today’s close or fall to next possible level of support. Between here and next support level, the drop can be quick and volatile since the rise to this level was pretty quick and dramatic.

The SP500 broke below the 1085 support during intraday. Near the close, the SP500 was able to regain some of the losses and closed fractionally under 1085. Similarly for the DJIA, if it doesn’t bounce back above the 10,160 level, 9650 is the next possible stop. The Russell 2000 paints the same picture. The tech heavy Nasdaq 100 already begun its fall to next possible support level of 1740. If it is indicative of things to come, then one should not be surprise to see the other market indices drop quickly to catch up to the Nasdaq 100. Of course, there is always that possibility of the Nasdaq 100 making a U-turn. But that possibility is more of a hope than reality because the market is in a state of looking for excuse to sell. Tomorrow GDP report will probably show a gain, and this fabricated GDP number could produce a headfake bounce. My bias on the market remains to be bearish.

Click on the following charts to get an enlarged view:

DJIA:


SP500:


Nasdaq 100:


Russell 2000:


Share It

Sunday, January 24, 2010

We Owe It, And We Own It

Here is the list of 'Biggest Holders of US Gov't Debt' from cnbc.com. Guess who is the #1 holder of US Government Debt ... US (us, me and you.) Now you know why the Federal Reserve is so reluctant to let its balance sheet be audited. If it reveals exactly how much money it is printing to buy up all the bonds that China, Japan, and others do not want at every bond auction, we will be shocked.

Here is the excerpt from cnbc.com:

1. Federal Reserve and US Intragovernmental Holdings

That’s right, the biggest holder of US government debt is actually inside the United States. The Federal Reserve system of banks and other US intragovernmental holdings account for a stunning $5.127 trillion in US Treasury debt. This is the most recent number available (Sept 2009), and is at an all-time high, rising in every reporting period since 2007. About a decade ago, the total government holdings were "only" $2.5 trillion.

So what will happen when the Fed printing press stop or slow down. You guess it, interest rate for these Treasury bonds has to go up in order to lure those foreign buyers to take them to finance our deficit.


Share It

Saturday, January 23, 2010

More Than Moving

For three consecutive days the DJIA had a triple digits loss. For this shorten trading week, all three major indices, DJIA, SP500, and the Nasdaq loss around 4%. Today’s drop was more than a move, it was a dive. Shortly after 1:00pm EST, the market started to accelerate on the downside. Most of the intermediate support levels I have mentioned in my previous post were broken. The DJIA, SP500 and Nasdaq 100 are coming down to test major support level. These support levels are: 1025 for the SP500, 9650 for the DJIA, and 1660 for the Nasdaq 100. One can sense the tone and sentiment for the market have changed. Will this down trend simply a correction or a reversal? This will depend on how the indices react when they reach the major support level. For now, the bias favors the downside. I will not be buying on the dip here.

Here are the updated charts with some possible support level to monitor:

DJIA:


SPX:


NDX:


RUT:


XLE:


XLK:


XLF:


Share It

Thursday, January 21, 2010

Are We Moving?

Finally, the SP500 broke out of the trading range after spending the last 2 weeks in a range bound trading pattern between 1130 and 1150. The market sold off today and the SP500 is preparing to test the 1115 support level. Is this the beginning of the correction that so many been waiting for?

As I have mentioned in my previous post to watch how some stocks behave after their blow-out earnings report for clues on where the market will be headed. From GS and GOOG price actions after their earnings report today, it looks like the market is heading down to test some key support levels. Not to ignore how INTC and IBM traded after their earnings report. I will not be surprise to see 1115 on the SP500 be broken and move down to test the 1085 level. If it breaks 1085, then the market is on the move to lower level, and I would call it something other than a correction. Until then, here is the updated SP500 daily chart. Click on it to get a larger view.

SPX:


The three key sectors that have been pushing the market higher for the last nine months are: financial, technology, and energy. The following charts show how the ETF for these sectors have been behaving and what key support levels to watch out for when the market move lower.

XLF:


XLK:


XLE:


Share It

Monday, January 18, 2010

A Look At The SP500

After 2 weeks of trading in the new year, not much has changed from the end of 2009. The weekly SP500 continue to be bullish. The SP500 40 weeks SMA has crossed over the 80 weeks SMA, and it continue to hold onto the support provided by March 2009 trend line.

On the daily basis, the SP500 appears to be getting ready for a pullback. After it has hit the bull flag measured move level of 1150, it has dipped back to test the March 2009 trend line for support. The recent weakness developed by the financial and tech sector could cause the SP500 to break below the supporting trend line and cause it to move down to the 1115 or 1085 level. If the SP500 moves below the 1085, this short term pull back could turn into more than a pull back. I will be keeping a close eye on its behavior when it breaks below the 1115 support level to gauge the possibility of it moving down to the 1085 level.

Here is a weekly and daily chart for the SP500.


If it holds support and move above the resistance level of 1150, then 1200 could be the next target for the SP500. Next trading week will be a busy week for earnings report. The way the market reacts to some expected strong results from company such as GS and GOOG will give us a clue on where the next level of support/resistance for the SP500.


Share It

Sunday, January 10, 2010

Happy New Year!

The first week of trading in 2010 was quite interesting with all those data watchers (the media talking heads) focused on the job report. A big deal was made on the widely anticipated positive job report last Friday, and it turns out to be a loss of 85,000 jobs. Based on the market’s reaction, it didn’t turn out to be such a big event as the talking heads made it to be. The market just keeps on crawling higher. The SP500 finally hit the measured move of the bull flag formed back in July 2009. The market appears to continue its bullish stance with sector rotation to provide the needed leadership. During the period in November and December 2009, the financial sector was weak. And at the end of the year, the financial started to show sign of reversing, and the first week of 2010, the financial was one of the strong sectors along with the energy sector that provided the catalyst for the first week's gains.

Here is an updated chart for the SP500:


As the economy struggle along, 2010 will be a year for dollar watching. Here is the chart for the dollar index, DXY, the ETF on the dollar/Euro, FXE, and the dollar ETF, UUP. Click on the chart to get a larger view and to read the commentary.

DXY


FXE


UUP


Here is a brief look at gold ETF, GLD.

GLD


Share It