Once again, the market continues to march higher. The DJIA closed at another new all time high at 14,662, up 89.2 points, and the SP500 also closed at a new all time high at 1570.25, up 8.08 points. But, the DJT closed down 75.26 points at 6087.04. This created another non-confirmed DJIA closing high. Under the Dow Theory, this non-confirmation indicates a reversal is coming. In addition to the DJT closing on a down note, the Russell 2000 also closed at 934.30, down 4.48 points. Furthermore, some of the market breadth indicators are also showing sign of weakness. All of these signs of weakness and divergence are telling us the market is in the topping process and caution should be applied.
The following video take a closer look at some of the market breadth indicators and the reason for closing the newly established long position on DIS during the after hour extended session.
Click here to view the video if you do not see a video player on your screen.
Showing posts with label Dow. Show all posts
Showing posts with label Dow. Show all posts
Wednesday, April 3, 2013
Tuesday, March 31, 2009
Who Screamed Fire
The DJI gave up some 400 points or 5% in the last two trading sessions after it has gained more than 1377 points, or 21% from the March 9 close of 6547.05. The SP500 gave up 45 points, or 5.4% from last Thursday's close. Similar to the DJI, the SP500 gained more than 156 points or 23% from the March 9 closing level. For the Nasdaq 100, it also has gained more than 237 points, or nearly 23% from the March 9 close. The Nasdaq also gave up 60 points, or 5% in the last two trading sessions.
This bear market rally was one of the most anticipated rally in the recent past and before last Thursday, there was a high level of anticipation for the inevitable pullback after this tremendous rally since March 9 new closing low. When the pullback finally arrive on Friday and continued onto today's trading, the pullback was quick and sizeable. Take a look at last Friday's market action, 133 of the 143 points loss for the trading session were incurred at the opening minutes. Likewise in today's trading, more than 222 points of the nearly 250 points loss were incurred in the first few minutes of trading. These kind of pullbacks remind me of an analogy of someone in a packed theater yelled "Fire". When the dreaded scream of "Fire!" was heard, everyone in the theater quickly got up from their seat and exited at their nearest exit. Just like the market, someone screamed "Fire!" and everyone exited. Now the question is "Who screamed fire?" Someone that actually saw a fire burning or the local fire marshal decided to conduct a fire drill.
Is this pullback signal the end of the bear market rally or is it simply a consolidation before the rally resume? Lets take a look at the SP500. In the first chart, I have drawn the price channel this rally has been climbing in. As one can see, the angle of ascend for this price channel is too steep to sustain. If this is the channel that define this rally, then today's price break is a breakdown of the price channel and a new down trend will be established.

The next chart is a less steep price channel using 780 as the support level for this pullback.

And finally,

using the November low at 740-750 as support level, this price channel is the widest of the three. How this pullback will play out is depended on which price channel define this bear market rally. If the most narrow and steepest price channel define this rally, then when the SP500 fail the support level at 750, it will signal that the DJI is heading down to a new market low. But if either one of the other two price channel define this rally, then look for further upside from this bear market rally before it ends.
Similar scenarios for the DJI and the Nasdaq 100.


So who screamed fire? Is there a fire or is this a fire drill. The market will tell us as it retrace to various support levels whether this pullback is a consolidation or a new down trend. Pay attention to the support levels for direction.
This bear market rally was one of the most anticipated rally in the recent past and before last Thursday, there was a high level of anticipation for the inevitable pullback after this tremendous rally since March 9 new closing low. When the pullback finally arrive on Friday and continued onto today's trading, the pullback was quick and sizeable. Take a look at last Friday's market action, 133 of the 143 points loss for the trading session were incurred at the opening minutes. Likewise in today's trading, more than 222 points of the nearly 250 points loss were incurred in the first few minutes of trading. These kind of pullbacks remind me of an analogy of someone in a packed theater yelled "Fire". When the dreaded scream of "Fire!" was heard, everyone in the theater quickly got up from their seat and exited at their nearest exit. Just like the market, someone screamed "Fire!" and everyone exited. Now the question is "Who screamed fire?" Someone that actually saw a fire burning or the local fire marshal decided to conduct a fire drill.
Is this pullback signal the end of the bear market rally or is it simply a consolidation before the rally resume? Lets take a look at the SP500. In the first chart, I have drawn the price channel this rally has been climbing in. As one can see, the angle of ascend for this price channel is too steep to sustain. If this is the channel that define this rally, then today's price break is a breakdown of the price channel and a new down trend will be established.

The next chart is a less steep price channel using 780 as the support level for this pullback.

And finally,

using the November low at 740-750 as support level, this price channel is the widest of the three. How this pullback will play out is depended on which price channel define this bear market rally. If the most narrow and steepest price channel define this rally, then when the SP500 fail the support level at 750, it will signal that the DJI is heading down to a new market low. But if either one of the other two price channel define this rally, then look for further upside from this bear market rally before it ends.
Similar scenarios for the DJI and the Nasdaq 100.


So who screamed fire? Is there a fire or is this a fire drill. The market will tell us as it retrace to various support levels whether this pullback is a consolidation or a new down trend. Pay attention to the support levels for direction.
Share It
Tweet

Saturday, January 24, 2009
Tug Of War
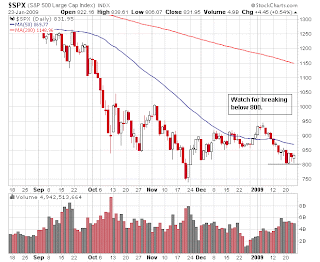
This week was quite an interesting week for the DJIA. In the last six trading sessions, the DJIA dipped below 8000 five times with it closing below 8000 once. It looks like clockwork, whenever the Dow dipped into the 7900 level, the bulls come out and turn the market around. And when the the Dow is back into the 8200 range, the bears push it down again. This tug of war not only indicative on how volatile this market is, but it is also telling us there are still strong forces to move the market down. Since the market's primary trend is down, the more times the Dow is being tested at the 8000 level, the higher the chance it will break below it and move further down. Therefore, next week will be interesting to watch on how this battle between the bulls and bears will play out. Since it is earning report season, any unpleasant surprises on the earning side will tip this battle toward the bears' favor. Here are the updated charts for the Dow, SP500 and the Nasdaq 100 (click on the image to get a larger view of the chart). Hold on to your seat for next week's battle of the bulls and the bears.



Share It
Tweet
Subscribe to:
Posts (Atom)