If you have listened to all the talking heads speaking about the possibility of a rate hike from the upcoming FOMC meeting, you might have walked away thinking the rate hike from the FED is a foregone conclusion. After next Wednesday, it will be a foregone conclusion on whether the FED did or did not hike the interest rate. But in the meantime, here are some charts for you to muddle a bit and see if indeed it is a foregone conclusion that the rate hike is imminent.
Showing posts with label xlk. Show all posts
Showing posts with label xlk. Show all posts
Friday, December 11, 2015
Monday, May 25, 2015
Listen To The Message
Last week on May 19, 2015, the market entered the record book again. The Dow Jones Industrial (DJI) and the SP-500 (SPX) recorded a new all time closing high.
Share It
Tweet

Saturday, December 21, 2013
Everyone Lined Up
After a day where the DJIA stands alone on making a new all time high, the other market indices regrouped and joined the DJIA on making another new all time high.
Share It
Tweet
Saturday, November 16, 2013
It Just Keep Going
The market simply keeps going up as there is nothing to impede its march toward the 16,000 for the DJIA and 1800 for the SP500. The Russell 2000 still lag all the market indices and warrant a close watch for clues of possible pull back or blow out.
The following chart shows how all the indices are synchronized on making new high while the Russell 2000 is trailing behind.
The following chart shows how all the indices are synchronized on making new high while the Russell 2000 is trailing behind.
Share It
Tweet
Sunday, July 29, 2012
Another Round Of QE Is Coming?
The market is appear to be pricing in some kind of easing from the Central Banks. Here is a look at some of the sectors that can help move the market higher.
Click on the title if you do not see a video player on your screen to view the video.
Click on the title if you do not see a video player on your screen to view the video.
Share It
Tweet
Sunday, May 20, 2012
Downtrend Continue
The US dollar continues to strengthen due to 'flight to safety' caused by the uncertainties from the Euro crisis and the direction of the US economy.
All the major sectors appear to have turned downward. Until the current uncertainties are removed from the market, the market will continue to be very news driven. Unless one is shorting this market, it is best to move to the sideline and wait for the dust to settle before start looking for long positions. Presently, it is best to be 'out of the market wishing you are in' than 'in the market wishing you are out'. Capital preservation is job one right now. Do not be tempted by a dead cat bounce that will likely to happen in the near term as the market is getting to the oversold condition. Wait for confirmation from the market that the end of the downtrend has occurred before moving back into the market.
Disclosure: Long SH, PSQ, and AAPL PUT
All the major sectors appear to have turned downward. Until the current uncertainties are removed from the market, the market will continue to be very news driven. Unless one is shorting this market, it is best to move to the sideline and wait for the dust to settle before start looking for long positions. Presently, it is best to be 'out of the market wishing you are in' than 'in the market wishing you are out'. Capital preservation is job one right now. Do not be tempted by a dead cat bounce that will likely to happen in the near term as the market is getting to the oversold condition. Wait for confirmation from the market that the end of the downtrend has occurred before moving back into the market.
Disclosure: Long SH, PSQ, and AAPL PUT
Share It
Tweet
Tuesday, April 10, 2012
Sector ETF Review
Here is a video reviewing some of the sectors that have been pushing the market up and how they could drag the market down.
Disclosure: no position
Disclosure: no position
Share It
Tweet
Monday, February 7, 2011
Murky Picture
The lagging market indices from last week have caught up with the DJIA and they all move to new recovery high today. The only remaining lagging market index is the Dow Jones Transportation (DJT). The DJT continue to trail all the market indices.
On the surface, the market still appears it wants to go higher. Underneath it, there are signs that this uptrend could be ending. One sign is the recent market leaders are showing some exhaustion price action. The semiconductor sector ETF, SMH made an intraday reversal today. The energy sector ETF, XLE wicked up and ended with an inverted hammer (shooting star) candle. The SP500 ETF, SPY also is beginning to show sign of fatigue. The QQQQ and the XLK ended the day with long wicked inverted hammer. If the market was not in an extended state, these inverted hammers or shooting stars will not be a concern. But this market has been rising without a pause or a correction, these price actions could be a sign that most of the longs are in the market and a reversal could occur shortly.
Here are the charts. The trend still look good, but the price action is a bit disturbing. The market is presenting a murky picture. Until the picture is cleared up, I am taking a step toward the sideline. I would rather err on the side of missing a big up move than being trapped in a sharp reversal.
SP500:

DJIA:

DJT:

Nasdaq 100:

QQQQ:

SPY:

XLK (Tech ETF):

SMH (Semiconductor ETF):

XLE (Energy ETF):

On the surface, the market still appears it wants to go higher. Underneath it, there are signs that this uptrend could be ending. One sign is the recent market leaders are showing some exhaustion price action. The semiconductor sector ETF, SMH made an intraday reversal today. The energy sector ETF, XLE wicked up and ended with an inverted hammer (shooting star) candle. The SP500 ETF, SPY also is beginning to show sign of fatigue. The QQQQ and the XLK ended the day with long wicked inverted hammer. If the market was not in an extended state, these inverted hammers or shooting stars will not be a concern. But this market has been rising without a pause or a correction, these price actions could be a sign that most of the longs are in the market and a reversal could occur shortly.
Here are the charts. The trend still look good, but the price action is a bit disturbing. The market is presenting a murky picture. Until the picture is cleared up, I am taking a step toward the sideline. I would rather err on the side of missing a big up move than being trapped in a sharp reversal.
SP500:

DJIA:

DJT:

Nasdaq 100:

QQQQ:

SPY:

XLK (Tech ETF):

SMH (Semiconductor ETF):

XLE (Energy ETF):

Share It
Tweet
Tuesday, November 16, 2010
Entered The Pull Back Zone
The SP500 has experienced four consecutive down days, and today it has entered the pull back zone between 1600 and 1800. The critical level for the SP500 and other major market indices in the near term will be their 50 SMA. If the SP500 does not find support near its 50 SMA, then there is a high probability it will retrace back to the 1125 to 1130 level (which is also near its 200 SMA).
The financial EFT, XLF has penetrated its 50 SMA intraday today, and the technology ETF, XLK is closing in on its 50 SMA. If the financial and the technology sector unable to find support near their 50 SMA, then most likely the SP500 will decline to the 1125-1130 to test for support.
One positive catalyst for the market this week is GM’s IPO. From the latest indication, the pricing of GM IPO will be above the initial price of 26-29 due to high demand for the shares. The debut of this IPO could provide some positive sentiments to the market on Thursday.
Although the SP500 is down more than 19 points or 1.6% today, but things appear to be stabilizing and/or turning around near the close. I will not be surprise to see some sort of short term oversold rally tomorrow. As far as trading goes, I will remain patient and wait until support has been established for this pull back before opening any new long positions. In the meantime, I will continue to do quick trades with reduced size (no holding period of more than 2 days).
SP500:

XLK:

XLF:

The financial EFT, XLF has penetrated its 50 SMA intraday today, and the technology ETF, XLK is closing in on its 50 SMA. If the financial and the technology sector unable to find support near their 50 SMA, then most likely the SP500 will decline to the 1125-1130 to test for support.
One positive catalyst for the market this week is GM’s IPO. From the latest indication, the pricing of GM IPO will be above the initial price of 26-29 due to high demand for the shares. The debut of this IPO could provide some positive sentiments to the market on Thursday.
Although the SP500 is down more than 19 points or 1.6% today, but things appear to be stabilizing and/or turning around near the close. I will not be surprise to see some sort of short term oversold rally tomorrow. As far as trading goes, I will remain patient and wait until support has been established for this pull back before opening any new long positions. In the meantime, I will continue to do quick trades with reduced size (no holding period of more than 2 days).
SP500:

XLK:

XLF:

Share It
Tweet
Sunday, November 14, 2010
1st Round Goes To Fibonacci
It appears the SP500 has found resistance at the 61.8% Fibonacci retracement level, and the first round goes to the Fibonacci traders while the pattern traders have to wait for their Head & Shoulder measured move to materialize.
Prior to the Fed's QE2 announcement, the tech sector has been leading the market up and the financial was in dormant. After the Fed announced its QE2 plan, the financial woke up and moved some of the skeptics into the market and this surge have triggered some profit taking. Since next week being an OpEx (option expiration) week, further shakeout with increasing volatility can be expected.
The market has not given any sign of a top, and the likely support from this pullback will be near the 50 SMA level (see the charts below). Until a support level has been established, buying the dip (bottom fishing) can be a risky move. I will be keeping a close watch on the 50 SMA for clues on whether the market will be resuming its rise or more pullbacks to come.
SP500:

XLF:

XLK:

Prior to the Fed's QE2 announcement, the tech sector has been leading the market up and the financial was in dormant. After the Fed announced its QE2 plan, the financial woke up and moved some of the skeptics into the market and this surge have triggered some profit taking. Since next week being an OpEx (option expiration) week, further shakeout with increasing volatility can be expected.
The market has not given any sign of a top, and the likely support from this pullback will be near the 50 SMA level (see the charts below). Until a support level has been established, buying the dip (bottom fishing) can be a risky move. I will be keeping a close watch on the 50 SMA for clues on whether the market will be resuming its rise or more pullbacks to come.
SP500:

XLF:

XLK:

Share It
Tweet
Sunday, March 21, 2010
It Did Not Disappoint
From my previous post, I have indicated the Dow Jones Transportation index told us the Dow Jones Industrial will move to its January 2009 high, and true to its form, the DJIA did not disappoint those Dow Theory watchers. Not only it has reached the January 2009 high, the DJIA surpassed it and moved to the bull flag measured move level of 10,800 intraday on Friday.
DJIA:

With the quadruple witching away, now the focus will be back to watching the price actions and listening to what the market has to say. The three primary sectors I am monitoring for signs on where the market is heading are; financial, energy, and the technology. The latest price actions from the XLF, XLE, and XLK, ETF for the financial, energy, and technology respectively are telling me a pullback is on its way. These ETFs along with many stocks have reached their price target level and started to weaken.
XLF:

XLE:

XLK:

Does this pullback signal the end of the rally? From the noise in the market about 1250 for the SP500, I doubt this pullback will put an end to this rally. If you have been following this blog for a while, you would have known this 1250 level is the measured move of the inverted head & shoulder pattern formed last year. Having many traders talking about this 1250 level, this level has become a target (we know what happen to targets…they get hit.)
SP500:

Before the SP500 will make a move toward this 1250 level, it has to complete the pullback it has started last week. The level of support for the SP500 in the near term is the 1115-1130. Look for this level to show some reactions. If it fails to find support at this level, then look for next potential support near 1085. For the near term, a lot of profits need to be shaken out. Therefore, I am taking the short side.
DJIA:

With the quadruple witching away, now the focus will be back to watching the price actions and listening to what the market has to say. The three primary sectors I am monitoring for signs on where the market is heading are; financial, energy, and the technology. The latest price actions from the XLF, XLE, and XLK, ETF for the financial, energy, and technology respectively are telling me a pullback is on its way. These ETFs along with many stocks have reached their price target level and started to weaken.
XLF:

XLE:

XLK:

Does this pullback signal the end of the rally? From the noise in the market about 1250 for the SP500, I doubt this pullback will put an end to this rally. If you have been following this blog for a while, you would have known this 1250 level is the measured move of the inverted head & shoulder pattern formed last year. Having many traders talking about this 1250 level, this level has become a target (we know what happen to targets…they get hit.)
SP500:

Before the SP500 will make a move toward this 1250 level, it has to complete the pullback it has started last week. The level of support for the SP500 in the near term is the 1115-1130. Look for this level to show some reactions. If it fails to find support at this level, then look for next potential support near 1085. For the near term, a lot of profits need to be shaken out. Therefore, I am taking the short side.
Share It
Tweet
Sunday, January 31, 2010
Payback Time
It appears the bears are in control now, and the price actions are a mirror image of the time when the bulls have control of the market. Major indices failed to hold the current support level and the bears took it down decisively. For those that been buying into this dip is probably feeling it now. Click on the following charts to view where the next possible support level might be and to read the commentary. The bias remains to be bearish. Buying here could be like catching a falling knife.
DJIA:

SPX:

NDX:

RUT:

XLE:

XLK:

XLF:

DJIA:

SPX:

NDX:

RUT:

XLE:

XLK:

XLF:

Share It
Tweet
Saturday, January 23, 2010
More Than Moving
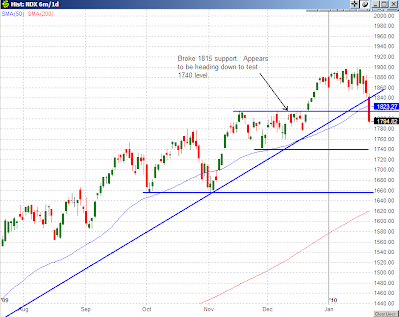
For three consecutive days the DJIA had a triple digits loss. For this shorten trading week, all three major indices, DJIA, SP500, and the Nasdaq loss around 4%. Today’s drop was more than a move, it was a dive. Shortly after 1:00pm EST, the market started to accelerate on the downside. Most of the intermediate support levels I have mentioned in my previous post were broken. The DJIA, SP500 and Nasdaq 100 are coming down to test major support level. These support levels are: 1025 for the SP500, 9650 for the DJIA, and 1660 for the Nasdaq 100. One can sense the tone and sentiment for the market have changed. Will this down trend simply a correction or a reversal? This will depend on how the indices react when they reach the major support level. For now, the bias favors the downside. I will not be buying on the dip here.
Here are the updated charts with some possible support level to monitor:
DJIA:

SPX:

NDX:
RUT:

XLE:

XLK:

XLF:

Here are the updated charts with some possible support level to monitor:
DJIA:

SPX:

NDX:

RUT:

XLE:

XLK:

XLF:

Share It
Tweet
Thursday, January 21, 2010
Are We Moving?
Finally, the SP500 broke out of the trading range after spending the last 2 weeks in a range bound trading pattern between 1130 and 1150. The market sold off today and the SP500 is preparing to test the 1115 support level. Is this the beginning of the correction that so many been waiting for?
As I have mentioned in my previous post to watch how some stocks behave after their blow-out earnings report for clues on where the market will be headed. From GS and GOOG price actions after their earnings report today, it looks like the market is heading down to test some key support levels. Not to ignore how INTC and IBM traded after their earnings report. I will not be surprise to see 1115 on the SP500 be broken and move down to test the 1085 level. If it breaks 1085, then the market is on the move to lower level, and I would call it something other than a correction. Until then, here is the updated SP500 daily chart. Click on it to get a larger view.
SPX:

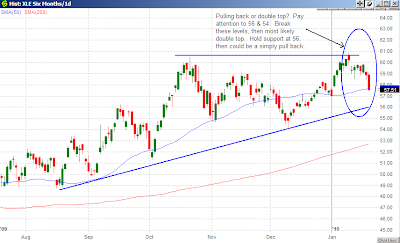
The three key sectors that have been pushing the market higher for the last nine months are: financial, technology, and energy. The following charts show how the ETF for these sectors have been behaving and what key support levels to watch out for when the market move lower.
XLF:

XLK:

XLE:
As I have mentioned in my previous post to watch how some stocks behave after their blow-out earnings report for clues on where the market will be headed. From GS and GOOG price actions after their earnings report today, it looks like the market is heading down to test some key support levels. Not to ignore how INTC and IBM traded after their earnings report. I will not be surprise to see 1115 on the SP500 be broken and move down to test the 1085 level. If it breaks 1085, then the market is on the move to lower level, and I would call it something other than a correction. Until then, here is the updated SP500 daily chart. Click on it to get a larger view.
SPX:

The three key sectors that have been pushing the market higher for the last nine months are: financial, technology, and energy. The following charts show how the ETF for these sectors have been behaving and what key support levels to watch out for when the market move lower.
XLF:

XLK:

XLE:

Share It
Tweet
Sunday, August 9, 2009
Funny Math
Maybe it's me, I just don't get it. When you subtract 240,000 jobs from the work force, doesn't that mean more people is being unemployed. If yes, then how can the unemployment rate go down from 9.5% to 9.4% if there are more people without job. Did I miss the new job creation number of more than 240,000 somewhere? It must be the new funny math.
The market looks like it was getting ready for a pullback, then this funny math job number came out on Friday and the market sucked it up and moved higher. This tells me there is panic money on the sideline waiting for any excuse to get in. Looking at the weekly chart for the DJIA, SP500, and the Nasdaq 100, they all seem to be bumping against resistance from Fib retracement level. If these indices can't move above these retracement levels, they will at least pullback to their recent breakout level (see the chart for details.) In addition to these indices, the two sectors that have been the catalyst for this rally, the financial and technology are also bumping up against resistance. As I see the market, I wouldn't be surprised to see some pullback in the week ahead.
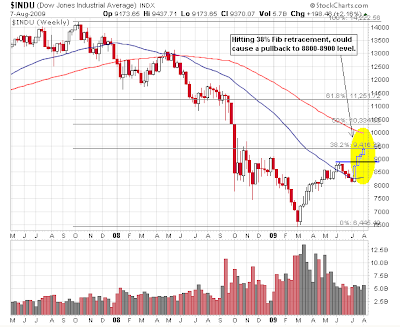
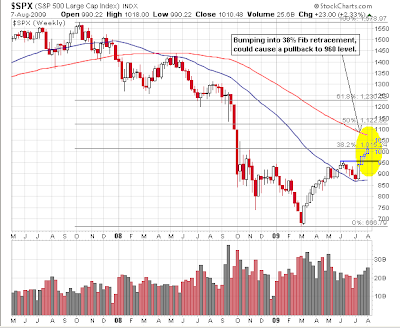


The market looks like it was getting ready for a pullback, then this funny math job number came out on Friday and the market sucked it up and moved higher. This tells me there is panic money on the sideline waiting for any excuse to get in. Looking at the weekly chart for the DJIA, SP500, and the Nasdaq 100, they all seem to be bumping against resistance from Fib retracement level. If these indices can't move above these retracement levels, they will at least pullback to their recent breakout level (see the chart for details.) In addition to these indices, the two sectors that have been the catalyst for this rally, the financial and technology are also bumping up against resistance. As I see the market, I wouldn't be surprised to see some pullback in the week ahead.


Share It
Tweet
Friday, June 26, 2009
Rough Start
After a rough start at the beginning of the week, the market finished the week with somewhat of a mixed picture. The DJIA gave back little bit more than 1%, approximately 101 points for the week by closing around 9438. The SP500 is essentially flat, losing 0.25% or approximately 2 points and closed near the 919, and the Nasdaq 100 gained about 9 points or 0.6% by closing out the week at 1480. On the surface, these point losses do not appear to be significant, but the manner in which the market has behaved throughout the week is worth a second look.
Prior to Monday, the three major indices, DJIA, SP500 and Nasdaq 100 were riding on their upward trend line. When the week starts, the DJIA encountered three consecutive down days that took it down to near the 8250 level to find support. On Thursday, all three indices went up for the first time (the only time) this week and bought the DJIA back to the 200 SMA to test for resistance. The SP500 did not do too much better than the DJIA. It has broken below the 50 and 200 SMA before it bounces back above these two moving averages. Now, the SP500 is approaching the 925-930 resistance level where this level was previously its support. Not all is negative for the SP500. During the course of this correction, the SP500 50 SMA did crossed over the 200 SMA, but with a very weak (almost flat) up slope. The only index that seems to show some strength is the Nasdaq 100. After it has come down and tested the 50 SMA for support, it has recovered all its earlier losses and ended up with a small net gain for the week.


Next week will probably be another nail biter. Any signs of the DJIA fails to reassert and hold above the 200 SMA, and the SP500 unable to reclaim the 930 level, the bears will jump in and pound on them to retest those critical support levels I have indicated from my previous post. The only danger for the Nasdaq 100 is that it might be dragged down by the down draft from the DJIA & SP500. Presently, the tech sector appears to be the one with the strength and it probably will be the leader to take the market up if this bear market rally is to be continued.
For now, I will avoid the energy and the financials sector. I am also keeping clear away from the consumer discretionary and the consumer staples. The only sector I will focus on is the tech until the DJIA & SP500 have demonstrated they have regained some of the technical strength they have recently loss.


Prior to Monday, the three major indices, DJIA, SP500 and Nasdaq 100 were riding on their upward trend line. When the week starts, the DJIA encountered three consecutive down days that took it down to near the 8250 level to find support. On Thursday, all three indices went up for the first time (the only time) this week and bought the DJIA back to the 200 SMA to test for resistance. The SP500 did not do too much better than the DJIA. It has broken below the 50 and 200 SMA before it bounces back above these two moving averages. Now, the SP500 is approaching the 925-930 resistance level where this level was previously its support. Not all is negative for the SP500. During the course of this correction, the SP500 50 SMA did crossed over the 200 SMA, but with a very weak (almost flat) up slope. The only index that seems to show some strength is the Nasdaq 100. After it has come down and tested the 50 SMA for support, it has recovered all its earlier losses and ended up with a small net gain for the week.


Next week will probably be another nail biter. Any signs of the DJIA fails to reassert and hold above the 200 SMA, and the SP500 unable to reclaim the 930 level, the bears will jump in and pound on them to retest those critical support levels I have indicated from my previous post. The only danger for the Nasdaq 100 is that it might be dragged down by the down draft from the DJIA & SP500. Presently, the tech sector appears to be the one with the strength and it probably will be the leader to take the market up if this bear market rally is to be continued.
For now, I will avoid the energy and the financials sector. I am also keeping clear away from the consumer discretionary and the consumer staples. The only sector I will focus on is the tech until the DJIA & SP500 have demonstrated they have regained some of the technical strength they have recently loss.


Share It
Tweet
Wednesday, June 24, 2009
The Three Sectors
The three primary sectors that have led this bear market rally are: financial, energy, and technology. In order for this bear market rally to continue, these three sectors must resume its leadership. To get a perspective on how these sectors are performing, I will analyze their respective ETF, XLF for the financial, XLE for the energy, and XLK for the technology.
First up is the XLF, it has performed strongly since the March 2009 market low and the stress test was initiate on 19 major financial institutions. Recently, the strength from this sector have diminished and starting to roll away from the major moving averages and broken below the price channel support. Unless it can hold the April high and the May low support, and the 50 SMA along with the 20 EMA can reverse direction, this bear market rally for the financial will come to an end.

The energy was another sector that has shown tremendous strength during this bear market rally. As crude oil moved above the $70 a barrel, the energy sector begins to top out. Recently, the price action on the XLE has broken down and it looks very likely to be heading lower. Very doubtful this sector will provide the strength to keep this bear market rally going.

Finally, the tech sector appears to be catching its last breath. It is still hanging in the price channel and holding minor support. This sector along with some defensive sectors could provide strength to continue this bear market rally for a bit longer. It is this wild card that the market has not shown us the direction it will take.

Without the participation from any of these three sectors, this bear market rally cannot be sustained. As the 'green shoots' started to brown, and lack of evidence a recovery is around the corner, other sectors will also roll over and headed down.
First up is the XLF, it has performed strongly since the March 2009 market low and the stress test was initiate on 19 major financial institutions. Recently, the strength from this sector have diminished and starting to roll away from the major moving averages and broken below the price channel support. Unless it can hold the April high and the May low support, and the 50 SMA along with the 20 EMA can reverse direction, this bear market rally for the financial will come to an end.

The energy was another sector that has shown tremendous strength during this bear market rally. As crude oil moved above the $70 a barrel, the energy sector begins to top out. Recently, the price action on the XLE has broken down and it looks very likely to be heading lower. Very doubtful this sector will provide the strength to keep this bear market rally going.

Finally, the tech sector appears to be catching its last breath. It is still hanging in the price channel and holding minor support. This sector along with some defensive sectors could provide strength to continue this bear market rally for a bit longer. It is this wild card that the market has not shown us the direction it will take.

Without the participation from any of these three sectors, this bear market rally cannot be sustained. As the 'green shoots' started to brown, and lack of evidence a recovery is around the corner, other sectors will also roll over and headed down.
Share It
Tweet
Subscribe to:
Posts (Atom)