In this weekly stock market update and analysis, we will review the stock market internals and the SP500 to see if the market has bottomed and where it might be headed in the near term. We will also analyze the US dollar, gold, and oil. Finally, we will review the FAANG stocks to see how they are holding up.
Showing posts with label USO. Show all posts
Showing posts with label USO. Show all posts
Sunday, March 22, 2020
Sunday, January 12, 2020
STOCK MARKET WENT PARABOLIC
The stock market has gone parabolic! In this weekly stock market update, we will look at the SP500 cash index, the emini futures for the SP500, Nasdaq 100, Russell 2000, crude oil, gold and the U.S. dollar.
Share It
Tweet

Sunday, June 24, 2018
Where's The Price Of Oil After OPEC's Decision?
In this video, we will take a look at some possible scenarios on what the crude oil price might do in the near future.
Click here to view the video.
Click here to view the video.
Share It
Tweet
Sunday, December 13, 2015
Oil Prices
Everyone is calling for lower oil prices and with the level on oil inventory along with 'don't stop the pump' from Saudi Arabia, it is logical to expect lower prices. After all, it is the first law of economics; supply and demand! But as most things in life, it is not so black and white. There are always external factors that make everything ideal to be more reality, some people call them second order effects and I call them unintentional consequences. Whatever one might call these external effects, they do alter the pricing equation based on supply and demand. For oil, it is what one might call "Geopolitical effects."
Share It
Tweet
Tuesday, April 14, 2015
Interesting Energy Stocks
If you are not one of those people that are still waiting for the price of crude oil fall to the $30's or $20's or even for a new low, then you might find the following energy stocks to be interesting.
Share It
Tweet
Sunday, February 1, 2015
Weekly Stocks & Market Review - 2/1/2015
Here is a look at the market and these MOMO stocks: AAPL, NFLX, GPRO, BABA, FB, TWTR, TSLA, AMZN & GOOGL.
Share It
Tweet
Tuesday, January 27, 2015
Some Notable Twitter Post -1/27/2015
In case you might have missed it, here are some of the post I've made on my twitter stream today that might be of some interest to you.
Share It
Tweet
Sunday, November 23, 2014
Black Gold
Couple weeks ago we started to look at gold after we have observed a possible near term bottom type of price action. Today, we will take a look at the oil or black gold. Oil appears to have put in a near term bottom that might present some near term swing long trades along with some of the energy stocks.
Share It
Tweet
Tuesday, November 4, 2014
Oil Hidden Agenda
The current falling oil price is not all about excess supply or the slowing down of the global economy. It is about control, the control of world oil prices by OPEC. As US oil producers refined and improved the fracking technology for extracting oil, this has caused a hidden price war launched by OPEC to retain control of the oil market. While there is an oversupply of oil, the largest OPEC oil producer, Saudi Arabia has not reduced its oil production to halt the falling price of oil. Not only OPEC did not cut production, it has just reduced the price of oil destined to the US. This price reduction has two purposes, one is to retain market share, and second is to determine at what price level it will cause US oil producers to cut their production. It is vital for OPEC to know the US producers’ breakeven price level in order to control the world oil market.
Share It
Tweet
Friday, December 7, 2012
The Rising US Dollar Effects
The US dollar reversed its decline and gathering strengths. Looking at the DXY (US dollar index) chart, this index could be heading toward 81.75 from the recent low near 70.50.

Conversely, the Euro started to decline from its recent high 130.13 toward the 127 level. If it fails to hold 127, it could fall to the previous pivot low near 125.90.

Similarly, the price of crude will fall as the US dollar rise. From the chart for the crude ETF, USO could drop to 29.50, where the spot price for light crude will be near 78 per barrel.

Finally, the price of gold could also fall along with other commodities prices. The ETF for gold, GLD could drop to 162 that mean gold could be less than 1680 per ounce. If it cannot hold the 1680 per ounce, it could drop to 1620 per ounce or near 157.50 for GLD.


Conversely, the Euro started to decline from its recent high 130.13 toward the 127 level. If it fails to hold 127, it could fall to the previous pivot low near 125.90.

Similarly, the price of crude will fall as the US dollar rise. From the chart for the crude ETF, USO could drop to 29.50, where the spot price for light crude will be near 78 per barrel.

Finally, the price of gold could also fall along with other commodities prices. The ETF for gold, GLD could drop to 162 that mean gold could be less than 1680 per ounce. If it cannot hold the 1680 per ounce, it could drop to 1620 per ounce or near 157.50 for GLD.

Share It
Tweet
Wednesday, July 18, 2012
Market Review - 7/18/2012
Here is a look at the market indice and some of the stocks that moved the market for the day.
Share It
Tweet
Video Posted Prior To Market Open
Better late than never...forgot to post these video on the blog. Here they are..
Share It
Tweet
Thursday, June 21, 2012
Oil Prices Down...Watch The Airliners
With the crude oil prices coming down, keep an eye on the airliners for potential upside move. The market is still poise to move higher. Could see a near term consolidation before breaking out to higher ground. Monitoring AAPL to break above the $590 level. Look for possible move to 620 area when it breaks above $590.
Watch the video for details.
Disclosure: long AAPL CALL, UNG, JBLU
Watch the video for details.
Disclosure: long AAPL CALL, UNG, JBLU
Share It
Tweet
Sunday, May 20, 2012
Downtrend Continue
The US dollar continues to strengthen due to 'flight to safety' caused by the uncertainties from the Euro crisis and the direction of the US economy.
All the major sectors appear to have turned downward. Until the current uncertainties are removed from the market, the market will continue to be very news driven. Unless one is shorting this market, it is best to move to the sideline and wait for the dust to settle before start looking for long positions. Presently, it is best to be 'out of the market wishing you are in' than 'in the market wishing you are out'. Capital preservation is job one right now. Do not be tempted by a dead cat bounce that will likely to happen in the near term as the market is getting to the oversold condition. Wait for confirmation from the market that the end of the downtrend has occurred before moving back into the market.
Disclosure: Long SH, PSQ, and AAPL PUT
All the major sectors appear to have turned downward. Until the current uncertainties are removed from the market, the market will continue to be very news driven. Unless one is shorting this market, it is best to move to the sideline and wait for the dust to settle before start looking for long positions. Presently, it is best to be 'out of the market wishing you are in' than 'in the market wishing you are out'. Capital preservation is job one right now. Do not be tempted by a dead cat bounce that will likely to happen in the near term as the market is getting to the oversold condition. Wait for confirmation from the market that the end of the downtrend has occurred before moving back into the market.
Disclosure: Long SH, PSQ, and AAPL PUT
Share It
Tweet
Tuesday, April 10, 2012
Sector ETF Review
Here is a video reviewing some of the sectors that have been pushing the market up and how they could drag the market down.
Disclosure: no position
Disclosure: no position
Share It
Tweet
Sunday, December 13, 2009
Continue To Watch The US Dollar
It was another week of sideway trading for the market. The weakness from the financial and energy sectors is being compensated by the strength from the tech, industrial and consumer discretionary sectors. Until this balance of power is changed, I am expecting more sideway actions to continue for the market. The catalyst that can alter the current balance of power is the US dollar.
As the dollar gains strength, those dollar carry trades will be unwounded and that will bring to the end of this round of musical chair. To monitor the movement of the dollar, I have put up the following charts with key levels identified for potential breakout. In addition, I have also taken a closer look at the financial. It appears something might be developing that could cause a major break for the market. Whatever that might be, only time will tell. For now, one might take a look at some individual stocks in this sector, i.e. GS, WFC, JEF, JPM, MS, and BAC, to get a sense of the developing weakness in this sector. I will post more about the financial and some possible scenarios to watch for 2010. In the meantime, here are the charts. Click on them to get a larger view of the chart.
DXY

UUP

FXE

OIH

USO

GLD

XLF
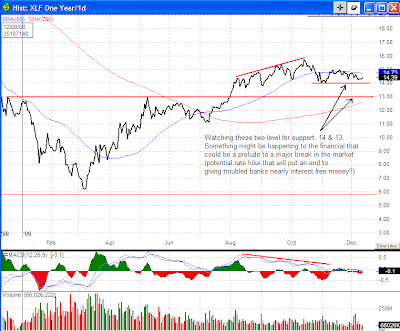
As the dollar gains strength, those dollar carry trades will be unwounded and that will bring to the end of this round of musical chair. To monitor the movement of the dollar, I have put up the following charts with key levels identified for potential breakout. In addition, I have also taken a closer look at the financial. It appears something might be developing that could cause a major break for the market. Whatever that might be, only time will tell. For now, one might take a look at some individual stocks in this sector, i.e. GS, WFC, JEF, JPM, MS, and BAC, to get a sense of the developing weakness in this sector. I will post more about the financial and some possible scenarios to watch for 2010. In the meantime, here are the charts. Click on them to get a larger view of the chart.
DXY

UUP

FXE

OIH

USO

GLD

XLF

Share It
Tweet
Sunday, October 25, 2009
The Catalyst
Back in April when I first posted the possibility for oil to go to $75 a barrel , I stated I have no idea what will trigger it to that level. In April, I was purely interpreting the cup & handle chart formation and projected the measured move to the $75 level. But now, we all know the catalyst for the oil to move above and beyond this measured move of $75 a barrel. No, it’s not due to increase in demand for oil and it’s not the ‘green shoot’ crap those talking heads were preaching how the economy is recovering. It’s the printing of the US dollar that caused the price for commodities such as oil (and gold) to rise. As the dollar weakens, oil prices and other commodities prices started to rise. Now that oil has reached above $80 a barrel while the US economy is still in a recession, the manipulators will come out and push the price back to the $60 level where OPEC can live with and won’t cause dramatic price pressure for the US consumers. The present state of the US economy cannot withstand $80 or even $70 a barrel of oil for a sustained period without killing off the already weak US consumer spending.
Here is an intraday hourly chart of the ETF for the US dollar, UUP.

Prices have been creeping up and broke above the downward trendline. A divergence on the MACD is signaling a possible trend change. I believe the Fed will start hinting a possible rate hike in the near future to talk up the US dollar. The fear of this potential rate hike that could delay the US economy from recovering will put a temporary halt to the stock market rally, and the commodities trades based on weak US dollar will start to unwind and that will take the oil back below $60 and gold under $1000 an ounce. Take a look at the following charts for some of the key levels in the near term for oil, gold ETF:


Here is an intraday hourly chart of the ETF for the US dollar, UUP.

Prices have been creeping up and broke above the downward trendline. A divergence on the MACD is signaling a possible trend change. I believe the Fed will start hinting a possible rate hike in the near future to talk up the US dollar. The fear of this potential rate hike that could delay the US economy from recovering will put a temporary halt to the stock market rally, and the commodities trades based on weak US dollar will start to unwind and that will take the oil back below $60 and gold under $1000 an ounce. Take a look at the following charts for some of the key levels in the near term for oil, gold ETF:


Share It
Tweet
Tuesday, April 14, 2009
Another Look At Gold & Oil
The market did another pullback today but nothing warrant me to change my previous assessment about the market. Therefore, I thought I use this opportunity to take another look at gold and oil.
The Gold
Gold did a turn around going from targeting the 1000 mark to reversing back down toward the low 800 level. Since it reached near the 970 in mid March, it has reversed and dipped below the 50 SMA. Just a few days ago, it came close to testing the 200 SMA for support. The recent price actions have established a lower high and lower low, thus forming a down trend. From the gold continuous contract daily chart, a downward price channel can be drawn that point to a support near the 800 level. Unless the recent bounce off the 200 SMA re-establish a new higher high that can turn into a new rising trend, I will continue to watch it for lower prices.

A similar downward price channel is also being formed on the ETF GLD daily candlestick chart. This price channel points to support near the 80 level.

For those that are interested in playing the downside on gold using ETF without shorting the GLD, you might want to conside trading the GLL. This is the ultra short ETF on gold. This is a leveraged ETF, like all other leveraged ETFs, they are for short term trading only. Do not hold these ETFs too long. The volume on the GLL is relatively low comparing to the GLD, so watch the spread.

The Oil
The oil continuous contract was forming a rounded bottom until the last week or so. The rounded bottom has transformed into a cup & handle pattern with a measured move that could put the price in the 70s.

For the ETF, USO, an inverted head & shoulder pattern is being formed. The measured move from this H&S pattern could put the price in the 45 range.

The projected price levels from these charts are pending on the completion of their respective price pattern and breaking out from it. I have not identify what might trigger the crude prices to move to these levels. For now, I'm just monitoring it to see if this scenario will play itself out. Until then, I'm not initiating any trade on USO under this scenario, but that doesn't mean I won't be trading USO under other technical guidance. In the near term, I still believe oil will be trading in the 45-55 range.
The Gold
Gold did a turn around going from targeting the 1000 mark to reversing back down toward the low 800 level. Since it reached near the 970 in mid March, it has reversed and dipped below the 50 SMA. Just a few days ago, it came close to testing the 200 SMA for support. The recent price actions have established a lower high and lower low, thus forming a down trend. From the gold continuous contract daily chart, a downward price channel can be drawn that point to a support near the 800 level. Unless the recent bounce off the 200 SMA re-establish a new higher high that can turn into a new rising trend, I will continue to watch it for lower prices.

A similar downward price channel is also being formed on the ETF GLD daily candlestick chart. This price channel points to support near the 80 level.

For those that are interested in playing the downside on gold using ETF without shorting the GLD, you might want to conside trading the GLL. This is the ultra short ETF on gold. This is a leveraged ETF, like all other leveraged ETFs, they are for short term trading only. Do not hold these ETFs too long. The volume on the GLL is relatively low comparing to the GLD, so watch the spread.

The Oil
The oil continuous contract was forming a rounded bottom until the last week or so. The rounded bottom has transformed into a cup & handle pattern with a measured move that could put the price in the 70s.

For the ETF, USO, an inverted head & shoulder pattern is being formed. The measured move from this H&S pattern could put the price in the 45 range.

The projected price levels from these charts are pending on the completion of their respective price pattern and breaking out from it. I have not identify what might trigger the crude prices to move to these levels. For now, I'm just monitoring it to see if this scenario will play itself out. Until then, I'm not initiating any trade on USO under this scenario, but that doesn't mean I won't be trading USO under other technical guidance. In the near term, I still believe oil will be trading in the 45-55 range.
Share It
Tweet
Tuesday, April 7, 2009
Where Are We?
After the market made more than 20% gain in the last four weeks, a pullback is not unusual. But with constant reminder from the talking heads that this rally is a bear market rally, fears get triggered whenever a pullback comes along. But if some key levels are being monitored, then one doesn't have to fear the pullback. Instead, one can be prepare to take advantage of the pullback when it occurs. So where are we?
The market is still in the rally mode until it has violated key support levels. Click on the following charts for a larger image to view those key support levels.


As I have mentioned before, I will tighten up my stops on my longs here and won't be aggressive on setting up new longs until after the key supports have been tested and held. I will wait until supports are broken and confirmed with negative momentum before I go short.
Where is gold now?
Since my last post on gold, it has made a turn to the downside. The chart for gold's continuous contract displays lower high and lower low, and this is a signature of a down trend. It is trying to find support from the 200 SMA. For the ETF, GLD, it is bouncing off the 200 SMA with a long shadow inverted hammer candle. If you are considering on trading gold on the short side via ETF, then you might take a look at the GLL. It is an ultra short on gold. Be careful on these leveraged ETF, they are for trading purposes only and not for long term holding.


What about oil?
Although oil has retreated back below $50 a barrel after it has moved above $55 for a brief moment, the trend still pointing toward the $50 and above level. It could be establishing a trading range between 45-55 for the near term. The ETF, USO is trending within a rising price channel with a near term top range of 33-34. I would go long on the USO whenever it bounces off the price channel's lower trendline for a swing trade.


The market is still in the rally mode until it has violated key support levels. Click on the following charts for a larger image to view those key support levels.


As I have mentioned before, I will tighten up my stops on my longs here and won't be aggressive on setting up new longs until after the key supports have been tested and held. I will wait until supports are broken and confirmed with negative momentum before I go short.
Where is gold now?
Since my last post on gold, it has made a turn to the downside. The chart for gold's continuous contract displays lower high and lower low, and this is a signature of a down trend. It is trying to find support from the 200 SMA. For the ETF, GLD, it is bouncing off the 200 SMA with a long shadow inverted hammer candle. If you are considering on trading gold on the short side via ETF, then you might take a look at the GLL. It is an ultra short on gold. Be careful on these leveraged ETF, they are for trading purposes only and not for long term holding.


What about oil?
Although oil has retreated back below $50 a barrel after it has moved above $55 for a brief moment, the trend still pointing toward the $50 and above level. It could be establishing a trading range between 45-55 for the near term. The ETF, USO is trending within a rising price channel with a near term top range of 33-34. I would go long on the USO whenever it bounces off the price channel's lower trendline for a swing trade.


Share It
Tweet
Friday, March 20, 2009
Now What?
With the quadruple witching over, now what?
The market sold off today during options expiration, but it is still holding most of the gains made from the recent up move. Looking at the technicals and the sentiments, I believe there is still more upside to come. The market might pullback to test for support before making its next move up. This test will give us a confirmation on the validity of the next move.
The chart below shows the DJI pulled back from the Nov 2008 low and it could end up at the nearest support level around 7100. If it fails to hold this support, then this relief rally is over and the DJI will be headed down for a new low. If it hold support at 7100, it can move back up to the 7500 level and possibly break above it. This next rally could be the one that will move some of the money on the sideline back into the market. Currently, there are too many people with the mindset that this is a bear market rally. Although we all know that is true. But the market will defy the herd mentally. It will continue to move up to force those non-believers into believing this rally is more than a bear market rally. In order to do this, the DJI will need to move above the 8000 to lure some of those sideline money in. My current scenario is, DJI need to hold 7100, then test 7500 and move toward 8000-8300. Of course, the market will be the ultimate decider on what it will do.

For the SP500, it pulled back from a confluence of resistance. It encountered resistance from two trendlines and the 50 SMA. It needs to hold support at the 750 level in order for the rally to continue. If the rally continue and it breaks above 800, it can potentially hit 870 before this rally come to an end. It is this possible scenario that I am holding off on shorting the market until I see more evidence that this bear market rally is coming to an end.

The Nasdaq 100 is still inside the trading range, and I expect it to continue to bounce around in there until it breaks the 1130 support.

Oil broke above $50 a barrel and heading higher. $55 a barrel is very likely in the near term.

Mid 30s for the ETF, USO is possible.

Gold took a breather today at a relatively low volume comparing to the two previous trading session. I believe it could hit $1000 an ounce and the ETF, GLD will go above 98.

My position on the market is to wait for it to pullback to support level. If the market hold support, then re-initiate longs otherwise renew shorts as the market is still in a bear market. I am continuing to monitor for trading opportunities in gold and oil via their ETF, GLD & USO respectively. These two commodities are now a play on the weak dollars and future inflation. Deflation at the moment is off the table with the latest Fed decision to buy long term treasuries.
The market sold off today during options expiration, but it is still holding most of the gains made from the recent up move. Looking at the technicals and the sentiments, I believe there is still more upside to come. The market might pullback to test for support before making its next move up. This test will give us a confirmation on the validity of the next move.
The chart below shows the DJI pulled back from the Nov 2008 low and it could end up at the nearest support level around 7100. If it fails to hold this support, then this relief rally is over and the DJI will be headed down for a new low. If it hold support at 7100, it can move back up to the 7500 level and possibly break above it. This next rally could be the one that will move some of the money on the sideline back into the market. Currently, there are too many people with the mindset that this is a bear market rally. Although we all know that is true. But the market will defy the herd mentally. It will continue to move up to force those non-believers into believing this rally is more than a bear market rally. In order to do this, the DJI will need to move above the 8000 to lure some of those sideline money in. My current scenario is, DJI need to hold 7100, then test 7500 and move toward 8000-8300. Of course, the market will be the ultimate decider on what it will do.

For the SP500, it pulled back from a confluence of resistance. It encountered resistance from two trendlines and the 50 SMA. It needs to hold support at the 750 level in order for the rally to continue. If the rally continue and it breaks above 800, it can potentially hit 870 before this rally come to an end. It is this possible scenario that I am holding off on shorting the market until I see more evidence that this bear market rally is coming to an end.

The Nasdaq 100 is still inside the trading range, and I expect it to continue to bounce around in there until it breaks the 1130 support.

Oil broke above $50 a barrel and heading higher. $55 a barrel is very likely in the near term.

Mid 30s for the ETF, USO is possible.

Gold took a breather today at a relatively low volume comparing to the two previous trading session. I believe it could hit $1000 an ounce and the ETF, GLD will go above 98.

My position on the market is to wait for it to pullback to support level. If the market hold support, then re-initiate longs otherwise renew shorts as the market is still in a bear market. I am continuing to monitor for trading opportunities in gold and oil via their ETF, GLD & USO respectively. These two commodities are now a play on the weak dollars and future inflation. Deflation at the moment is off the table with the latest Fed decision to buy long term treasuries.
Share It
Tweet
Subscribe to:
Posts (Atom)