Thursday, August 27, 2009

Continue To Frustrate

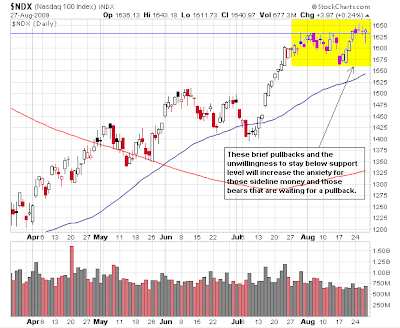
Frustrations continue to build as the market continues to tease those that are waiting on the sideline to get in, and for those bears that are short on the market. Today, the market opened on a weak note, then early afternoon the market turned around, and starts to recover the early losses and moved into positive territory. From the daily price chart, one can see how frustrating it must be for those bulls and bears that are waiting for a pullback. The market continues to print bullish doji and hammer like candles with long shadow while maintaining its upward bias by holding above support level.


Unless the bears are able to push the market below its support level and move it down for more than a few hours and more than a single day, the sideline money will just continue to buy on the dips, and continue to move this market higher.

Lot of talking heads is still talking about how extended the market is and how the market is overdue for a pullback. The more these talking heads talk about the pullback, the more fuels are being added to help move the market higher. Soon after these talking heads give up the thought on the impending pullback, then from the rushing in of the sideline money and the beaten up bears running for cover, the market will enter the climatic topping phase and blow itself back into its primary down trend.


Share It

Wednesday, August 26, 2009

Consolidation

So far this week, the market has been doing some consolidations. Although it has printed couple of shooting star or inverted hammer candles, these candles do not pose any threat to a possible reversal. Today the doji candle just further frustrates the bears and reinforces the perception that it is safe for the bulls to enter without great risk on the downside. The scenario I have stated previously is this market will not pullback to a degree that will scare the sideline money away, nor to the degree that will give satisfaction to the bears to take control on bringing the market down. Instead, the market will provide a safe entry for the anxious sideline money to come into the market on any dips, then as these anxious money starts to pile in, we will start seeing consecutive 300-500 points gain days. When that happens, the bears will be crushed and they will convert and join the bulls to push the market higher to a blowout stage. At this point, the market should start printing inverted hammer or shooting star with a big upside opening gap or a long candle shadow where the market give up more than 200 points intraday gains to close with a small fraction of the gain or even a slight loss for the day. It is at this point that the market will reverse back to its primary down trend and try to establish a bear market bottom.


Yes, I still believe this is a bear market rally. I do not believe all these government fabricated/manipulated statistics on how the economy has bottomed and a recovery is near. I don’t care if it is a V, U, or W recovery, all I know is I have not sensed any change in the economy that have made me say “things have gotten better.” I will remain long until the market tells me otherwise. I rather stay on the sideline than to short this market right now.


Share It

Saturday, August 22, 2009

Unchanged

The market has not changed its tune. I have posted the charts from my July 27, 2009 post below to show the potential upside levels have not changed.


At the present, the bias is for the market to continue to move toward those levels. Here are latest charts (these are daily closing price charts.)


I will continue to trade the uptrend until the market tells me otherwise.


Share It

Sunday, August 16, 2009

Continue To Defy

The market continues to defy conventional wisdoms. Every time the market appears to retreat, buyers step in and lift it higher. Since July, there are two forces pulling the market. On one end are the nervous sellers that have got in early on this rally and are in disbelieve this rally has got this far without a substantial pullback. The other is the anxious sideline money that has felt they have missed out on this rally and waiting anxiously to get in.

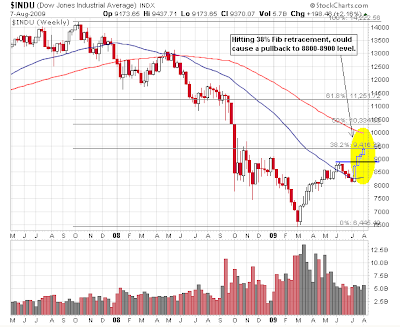
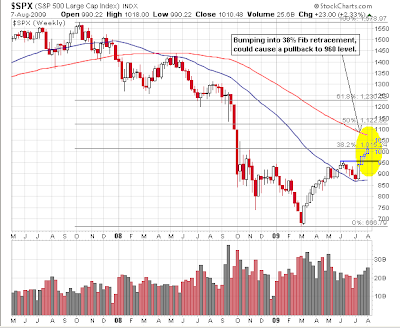
Right now, the DJIA, SP500, and the Nasdaq 100 are testing resistance at the Fib retracement level. The bears are anticipating a pullback, and the anxious sideline bulls are waiting for opportunity to get in, and the market will do what it will always do; the unexpected. The market will most likely consolidate at the current level around the Fib retracement to frustrate the bears and lure the anxious sideline bulls to move in. As these sideline money lift the market higher, those frustrated bears will convert and participate along with those sideline money to lift the market to a blowout stage. When everyone is all in, the market will then reverse.

For now, here is the weekly chart for the DJIA, SP500, and the Nasdaq 100. Note how the indices are hitting the Fib retracement level and where the likely support level will be if a pullback does materialize.


While the market is sorting things out, gold is sneaking up with little notice. It has positioned itself to the possibility on making another attempt on breaking the $1000 level. If it breaks above the level indicated in the chart, the move toward the $1000 level is highly probable. The gold mining stocks are also poised for a possible breakout. In the coming week, gold and gold mining stocks could be interesting to keep an eye on.


Share It

Sunday, August 9, 2009

Funny Math

Maybe it's me, I just don't get it. When you subtract 240,000 jobs from the work force, doesn't that mean more people is being unemployed. If yes, then how can the unemployment rate go down from 9.5% to 9.4% if there are more people without job. Did I miss the new job creation number of more than 240,000 somewhere? It must be the new funny math.

The market looks like it was getting ready for a pullback, then this funny math job number came out on Friday and the market sucked it up and moved higher. This tells me there is panic money on the sideline waiting for any excuse to get in. Looking at the weekly chart for the DJIA, SP500, and the Nasdaq 100, they all seem to be bumping against resistance from Fib retracement level. If these indices can't move above these retracement levels, they will at least pullback to their recent breakout level (see the chart for details.) In addition to these indices, the two sectors that have been the catalyst for this rally, the financial and technology are also bumping up against resistance. As I see the market, I wouldn't be surprised to see some pullback in the week ahead.


Share It

Sunday, August 2, 2009

Watching For A Sign

The market hasn’t changed much since my last post. Therefore, I won’t put up the daily charts. Instead, I will put up the 20 days hourly intraday chart for the DJIA, SP500, and the NASDAQ 100 to highlight the key levels I am monitoring for a sign of a pullback.

One of the common characteristic from these intraday charts is the slowing rise of the 5 day MA. In addition, prices are coming down to test for the 5 day MA for support. If the price rollover and goes below the 5 day MA, then the next sign for conforming a pullback is in progress is when the 5 day MA starts to rollover.

For the indices, here are the support levels I am watching, 9125 for the DJIA, 982 for the SP500, 1605 for the NASDAQ 100. If these levels are violated on the downside, be on the lookout for a pullback.


For the index ETF, DIA, SPY, and the QQQQ, here are the support level to watch, 91.27 for the DIA, 98.38 for the SPY, and 39.50 for the QQQQ.


Share It