Tesla stock price target got another upgrade today. In this video, we will analyze Tesla stock, and I will also show you a simple technique on how to project price targets for Tesla stock and for any stocks you are interested in.
Showing posts with label Fibonacci. Show all posts
Showing posts with label Fibonacci. Show all posts
Thursday, January 2, 2020
Sunday, June 9, 2019
How To Trade With Fibonacci Retracements & Fibonacci Extensions - 2019
In this tutorial video, I will demonstrate how to trade more objectively by using the Fibonacci retracement and the Fibonacci extension tool to help you determine potential price retracement levels and project potential price moves.
Share It
Tweet

Sunday, March 9, 2014
The Long & The Short On AAPL
Recently, AAPL has not been an easy stock to put on any kind of swing trade. It was easy to trade when it was in a trend. When it is chopping around like it has been recently, it could be very frustrating.
Share It
Tweet
Sunday, November 14, 2010
1st Round Goes To Fibonacci
It appears the SP500 has found resistance at the 61.8% Fibonacci retracement level, and the first round goes to the Fibonacci traders while the pattern traders have to wait for their Head & Shoulder measured move to materialize.
Prior to the Fed's QE2 announcement, the tech sector has been leading the market up and the financial was in dormant. After the Fed announced its QE2 plan, the financial woke up and moved some of the skeptics into the market and this surge have triggered some profit taking. Since next week being an OpEx (option expiration) week, further shakeout with increasing volatility can be expected.
The market has not given any sign of a top, and the likely support from this pullback will be near the 50 SMA level (see the charts below). Until a support level has been established, buying the dip (bottom fishing) can be a risky move. I will be keeping a close watch on the 50 SMA for clues on whether the market will be resuming its rise or more pullbacks to come.
SP500:

XLF:

XLK:

Prior to the Fed's QE2 announcement, the tech sector has been leading the market up and the financial was in dormant. After the Fed announced its QE2 plan, the financial woke up and moved some of the skeptics into the market and this surge have triggered some profit taking. Since next week being an OpEx (option expiration) week, further shakeout with increasing volatility can be expected.
The market has not given any sign of a top, and the likely support from this pullback will be near the 50 SMA level (see the charts below). Until a support level has been established, buying the dip (bottom fishing) can be a risky move. I will be keeping a close watch on the 50 SMA for clues on whether the market will be resuming its rise or more pullbacks to come.
SP500:

XLF:

XLK:

Share It
Tweet
Monday, September 14, 2009
Crushed Again!
Just when the bears think they have control, the dip buyers came in and bull(y) the bears back to their corner. As one can see from the hourly intraday chart, the SP500 open with a gap down today.

The bears pushed it down to the 5 days SMA and the dip buyers came in and moved the market back toward the opening range high. Throughout the morning, the bulls and bears were engaged in a battle to move the market into positive territory or keep it below last week’s close. Shortly after 1:00pm, the bulls got control and moved the SP500 into positive territory and then take out last week’s high in the final hour. Once again, the bears got crushed.
Let’s take a look at the daily and the weekly chart of the SP500 and see why the bears are constantly losing the battle for control.
Looking at the daily chart, it is showing the SP500 continues to make higher high and higher low.

The SP500 is flirting with the 1044 level and the momentum favors the SP500 to test the 1044 level for support than to retrace back to previous resistance-turned-support level of 950. If it does retrace below the 1044 level, it will most likely be a shallow retracement to the 1010-1020 range.
The 1010-1020 range on the weekly chart shown to be near the 38.2% Fib retracement level from 2007 high to March 2009 low.

Since the SP500 has established itself above this Fib retracement level, the resistance turned into support scenario comes into play, thus make this a viable support level. Next major resistance level is the rounded number of 1100. From the weekly chart, 1100 just happens to be near the 50% Fib retracement level. A major pull back or a possible reversal could occur when the SP500 reached this 1100/50% Fib retracement level. But until then, the measured move from the inverted H&S pattern put the SP500 at 1250, and this level is near the 61.8% Fib retracement. Therefore, even if there is a pull back from 1100, there still can be another major upward move to 1250 before this rally comes to an end.
All these technical levels clearly show why the bears are having such a hard time to take control of this market. As the bears keep fighting these technical levels, they will keep losing the battles. As a technician, I will trade the trend identified by these technical levels until the market tell me otherwise. Will we get a major correction? You bet, when we get complacent, the market will slap us with a big selloff. Right now, there are still too many skeptics and too many cautious traders (myself included.) Therefore, there will be more upside in the near term.

The bears pushed it down to the 5 days SMA and the dip buyers came in and moved the market back toward the opening range high. Throughout the morning, the bulls and bears were engaged in a battle to move the market into positive territory or keep it below last week’s close. Shortly after 1:00pm, the bulls got control and moved the SP500 into positive territory and then take out last week’s high in the final hour. Once again, the bears got crushed.
Let’s take a look at the daily and the weekly chart of the SP500 and see why the bears are constantly losing the battle for control.
Looking at the daily chart, it is showing the SP500 continues to make higher high and higher low.

The SP500 is flirting with the 1044 level and the momentum favors the SP500 to test the 1044 level for support than to retrace back to previous resistance-turned-support level of 950. If it does retrace below the 1044 level, it will most likely be a shallow retracement to the 1010-1020 range.
The 1010-1020 range on the weekly chart shown to be near the 38.2% Fib retracement level from 2007 high to March 2009 low.

Since the SP500 has established itself above this Fib retracement level, the resistance turned into support scenario comes into play, thus make this a viable support level. Next major resistance level is the rounded number of 1100. From the weekly chart, 1100 just happens to be near the 50% Fib retracement level. A major pull back or a possible reversal could occur when the SP500 reached this 1100/50% Fib retracement level. But until then, the measured move from the inverted H&S pattern put the SP500 at 1250, and this level is near the 61.8% Fib retracement. Therefore, even if there is a pull back from 1100, there still can be another major upward move to 1250 before this rally comes to an end.
All these technical levels clearly show why the bears are having such a hard time to take control of this market. As the bears keep fighting these technical levels, they will keep losing the battles. As a technician, I will trade the trend identified by these technical levels until the market tell me otherwise. Will we get a major correction? You bet, when we get complacent, the market will slap us with a big selloff. Right now, there are still too many skeptics and too many cautious traders (myself included.) Therefore, there will be more upside in the near term.
Share It
Tweet
Saturday, April 4, 2009
Is The Rally Over?
The market has been moving higher for the last four weeks and gained more than 20% since the March 9, 2009 closing low, so is this rally over? From the market's behaviors, it does not appear this rally is over. Instead, it appears the market is playing out this rally according to its script. It is converting more non-believers to buy into this rally. More talking heads are calling this rally more than a bear market rally, even some of them are calling this a new bull market rally. Furthermore, there are lot of talks that the market has bottomed on March 9, 2009. Sound like a bull trap? I'm not going to fight the tape. I will be long until the trap is set and be very watchful for signs to close all my longs before this bull trap is snapped.
Lets take a looking at the charts and those levels to watch for signs that the trap is about to be snapped.

From the DJI chart above, all the support and resistance levels drawn in blue are fairly close to the Fib retracement levels. The DJI first attempt on breaking the 8000 level resulted in a pullback to test the 7500 for support and to lessen the slope of the price channel. The success in the second attempt on breaking above the 8000 level included a test of support at the 8000 level (resistance turn into support). The trendline crossing into the price channel at 8250 should not be much of a resistance since ahead of this level are the stronger resistance at 8400 and the Fib 61.8% level. One of these two resistance levels could potentially be the reversal point.

The SP500 chart also show the resistance levels (drawn in red) are closely aligned with the Fib retracement levels. The trendline crossing the price channel should not pose too much of a resistance. The major resistance appears to be near the 880 level, where the resistance trendline and the Fib 61.8% are. This level should be closely monitor for possible reversal.

The Nasdaq 100 shows a slightly different characteristic than the DJI and SP500. It has broken through the trading range and probably will not encounter resistance until it reached the upper trendline of the price channel or the resistance level at 1380. The 1380 level need to be monitored for possible reversal point since the upper price channel trendline also crosses this point.
In the near term, the market appears to still have more upside. But the resistance levels mentioned here should be closely monitored for possible reversal. When these resistance levels are approached, I will tighten up my stops on the longs to avoid getting trapped with those late comers.
Lets take a looking at the charts and those levels to watch for signs that the trap is about to be snapped.

From the DJI chart above, all the support and resistance levels drawn in blue are fairly close to the Fib retracement levels. The DJI first attempt on breaking the 8000 level resulted in a pullback to test the 7500 for support and to lessen the slope of the price channel. The success in the second attempt on breaking above the 8000 level included a test of support at the 8000 level (resistance turn into support). The trendline crossing into the price channel at 8250 should not be much of a resistance since ahead of this level are the stronger resistance at 8400 and the Fib 61.8% level. One of these two resistance levels could potentially be the reversal point.

The SP500 chart also show the resistance levels (drawn in red) are closely aligned with the Fib retracement levels. The trendline crossing the price channel should not pose too much of a resistance. The major resistance appears to be near the 880 level, where the resistance trendline and the Fib 61.8% are. This level should be closely monitor for possible reversal.

The Nasdaq 100 shows a slightly different characteristic than the DJI and SP500. It has broken through the trading range and probably will not encounter resistance until it reached the upper trendline of the price channel or the resistance level at 1380. The 1380 level need to be monitored for possible reversal point since the upper price channel trendline also crosses this point.
In the near term, the market appears to still have more upside. But the resistance levels mentioned here should be closely monitored for possible reversal. When these resistance levels are approached, I will tighten up my stops on the longs to avoid getting trapped with those late comers.
Share It
Tweet
Monday, March 2, 2009
Back To 1996?
The SP500 dropped below the April 11, 1997 low today. I have mentioned in one of my earlier post that if the DJI drop to its April 11, 1997 low of 6391.69, the SP500 will be much lower than 737.65. The question is how low? Well, no one know. But looking at the 30 years monthly chart for the market indices, the levels in the month of July to September 1996 could be some possibilities for the DJI & SP500. Although it is too early to draw any conclusion that the SP500 will go down to the range of 625-650, and the DJI to the range of 5300-5600. But those are some of the key range to watch for. Here are the charts. I have circled what I believe are key levels and note how the Fibonacci retracement levels coincide with most of these key levels.
Click on the chart for a larger view.
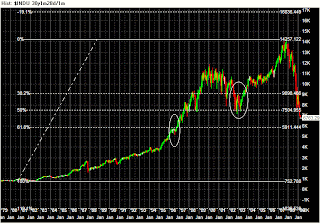


Click on the chart for a larger view.


Share It
Tweet
Thursday, February 12, 2009
Fibonacci Rule
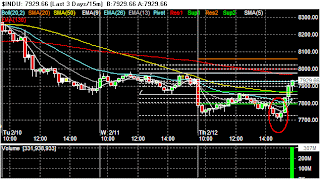
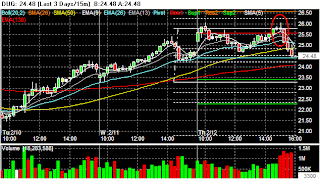
Today was another one of those last hour reversal day. Just an hour or so before the end of the trading session, the market started to reverse from a deficit of more than 200 points to closed nearly unchanged. What was striking is how and where the market started to turn around. You can call it coincidence, collution, natural behavior, or whatever you like. Take a look at the following charts where I have circled the spot where the market started to reverse. All of them reversed near or at a Fibonacci retracement level. I can see how some of the indices reverse at similar time, but at the same inflection point? If you are not watching Fibonacci retracement levels, you might want to consider it after you have reviewed these charts. As usual, click on the chart to get a larger image. The solid white line is the 0% & 100% Fibonacci level while the dotted lines are intermediate levels.




Share It
Tweet
Tuesday, February 10, 2009
The Great Experiment
The Secretary of Treasury finally revealed the highly anticipated TARP II bank bailout plan today. The Secretary said the new plan can cost up to $2T and will consist of many things, some of them will work and some of them might not. Obviously the market was very disappointed with the announcement because it lacked details, and it sounded like a great experiment of lets try different things and see what stick. With no great surprise, the financial stocks were sold off and the Dow dropped more than 380 points.
Last week in one of my post, I have allured a possible long trade for GS and MS. Today, that long trade came to an end. The following charts highlight the setup and exit I was monitoring for the trade on GS.

(click on the image to get a larger view)
In the GS daily chart, I use the January's high and low to establish the Fibonacci retracement levels for February trading. GS started to pullback near the end of January until the first bar (white arrow) in February, where it tested for support at the 62% Fib retracement. The 2nd candle in February, a hammer candle again tested the 62% retracement for support and presented the setup. A long position was triggered when the next candle (3rd bar in February) exceeded the high of the hammer candle (circled in red). The initial target is the 100% retracement level (red arrow) and the extended target will be the Fib Extension, 138% (FE, the most upper dotted line), while the low of the hammer will be used for establishing the stop loss level. On the 4th bar in Feb, it reached the initial target. Since this target is some distance away from the upper trendline, one could take a partial profit instead of exiting the position completely and leave a portion of the position to see if it can run up to the trendline. If it break through the trendline, then monitor it for possible move to the FE (138%) level. On Monday, the day before the TARP II announcement, a hangman candle was formed near the upper trendline. As the price started to retreat today and when it dropped below the lower body of the hangman, the position is closed. If one want to hang on for confirmation, then the position must be exited when the price dropped below the low of the hangman or risk in turning a profitable trade into a losing trade (circled yellow).

(click on the image to get a larger view)
In the 15 minutes intraday chart, an evening star reversal pattern was formed from the first 45 minutes of trading today (circled in red). This is a sign to get out, and when the price broke through the retracement zone, one shouldn't even have any second thought on closing out the position.
Until more details are presented for the TARP II, the financial stocks will most likely continue to be volatile. I will continue to monitor them for new trading opportunities.
Last week in one of my post, I have allured a possible long trade for GS and MS. Today, that long trade came to an end. The following charts highlight the setup and exit I was monitoring for the trade on GS.

(click on the image to get a larger view)
In the GS daily chart, I use the January's high and low to establish the Fibonacci retracement levels for February trading. GS started to pullback near the end of January until the first bar (white arrow) in February, where it tested for support at the 62% Fib retracement. The 2nd candle in February, a hammer candle again tested the 62% retracement for support and presented the setup. A long position was triggered when the next candle (3rd bar in February) exceeded the high of the hammer candle (circled in red). The initial target is the 100% retracement level (red arrow) and the extended target will be the Fib Extension, 138% (FE, the most upper dotted line), while the low of the hammer will be used for establishing the stop loss level. On the 4th bar in Feb, it reached the initial target. Since this target is some distance away from the upper trendline, one could take a partial profit instead of exiting the position completely and leave a portion of the position to see if it can run up to the trendline. If it break through the trendline, then monitor it for possible move to the FE (138%) level. On Monday, the day before the TARP II announcement, a hangman candle was formed near the upper trendline. As the price started to retreat today and when it dropped below the lower body of the hangman, the position is closed. If one want to hang on for confirmation, then the position must be exited when the price dropped below the low of the hangman or risk in turning a profitable trade into a losing trade (circled yellow).

(click on the image to get a larger view)
In the 15 minutes intraday chart, an evening star reversal pattern was formed from the first 45 minutes of trading today (circled in red). This is a sign to get out, and when the price broke through the retracement zone, one shouldn't even have any second thought on closing out the position.
Until more details are presented for the TARP II, the financial stocks will most likely continue to be volatile. I will continue to monitor them for new trading opportunities.
Share It
Tweet
Subscribe to:
Posts (Atom)