As I have mentioned in my previous post to watch how some stocks behave after their blow-out earnings report for clues on where the market will be headed. From GS and GOOG price actions after their earnings report today, it looks like the market is heading down to test some key support levels. Not to ignore how INTC and IBM traded after their earnings report. I will not be surprise to see 1115 on the SP500 be broken and move down to test the 1085 level. If it breaks 1085, then the market is on the move to lower level, and I would call it something other than a correction. Until then, here is the updated SP500 daily chart. Click on it to get a larger view.
SPX:

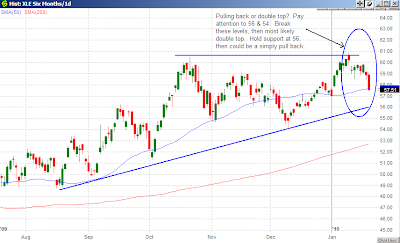
The three key sectors that have been pushing the market higher for the last nine months are: financial, technology, and energy. The following charts show how the ETF for these sectors have been behaving and what key support levels to watch out for when the market move lower.
XLF:

XLK:

XLE:
