Wednesday, August 3, 2011

Head Fake or Dead Cat Bounce

Is today's price action a head fake or a dead cat bounce?

Lets take a look at the inflection point that the market has reached during the first few days of the week and some of the technicals that have converged.


The first and foremost is the formation of the head & shoulder price pattern. Yesterday, the market sold off and broke below the H&S neckline. Prior to breaking the H&S pattern, the SP500 gave up the 1296 level last Friday. And after an agreement on the US debt ceiling was reached over the weekend, the SP500 opened with a large gap up on Monday and faded until the ISM number came out. The fade became a sell off that continued into Tuesday when the SP500 broke below the H&S neckline. Today, the sell off continued with a break below the long term supporting trendline that was formed between the March 2009 low to the present. Then buyers stepped in when the SP500 dipped below 1235 and rallied to close slightly above the supporting trendline with a bullish long wick hammer candle.

So will the market continue to rise or will it resume its drop? From the standpoint that the market will frustrate maximum number of participants, it will do both.

One scenario is the market will continue with this dead cat bounce for a few days to generate a bit of bullishness. Then as quickly as the bullish sentiments started to settle in, a new round of selling will trigger to take the market down to the 1225-1228 level and forces the long overdue capitulation before the seasonal summer rally/back to school rally starts.

This scenario is just one possibility...remember, the market will do what it will do, not what we want it to do! We trade base on what we see, not what we hope.


Share It

Sunday, July 31, 2011

Debt Ceiling

As of this writing, a deal was struck between the two political parties in Washington to increase the US debt ceiling and the SP500 future is rallying by adding more than 1%, +15.70. If the gains on the future hold up, a strong opening in New York will likely to occur. But don't let the euphoria take your eyes off the key technical levels. For the cash index, it must recapture and hold above 1295.92, and to close above Friday's high of 1304.16. And for the SPY (SP500 ETF), it must hold above 129.63 and close above 130.55 (see charts below.)

SP500:


SPY:


Share It

Friday, July 29, 2011

YOKU

Looks like YOKU could be making a move up toward the 200 SMA near the 40.50 level, and possibly could move to the upper bound of the rising price channel near 44.20 level of the 100 SMA.


Disclosure: no position on YOKU


Share It

Tuesday, July 26, 2011

Ready To Move

Here are three stocks that been beaten up for a while, and now they appear to be ready to move.

GS has been trending down and showing divergence between price & MACD. It has broken out the two months downward price channel and trying to break above 139.


HPQ formed an inverted head & shoulder between mid May to the present. If it breaks out of this price pattern, look for potential move to fill the price gap near 39-40 level.


MU has formed a double bottom and could be making a move higher.


Disclosure: long GS & MU, no position on HPQ


Share It

Sunday, July 3, 2011

The Dow Theory Has Spoken

From my last week post about the possibility of the US economy experiencing a double dip, I have suggested to keep an alert on the Dow Theory and keep a watch on some transportation stocks for clues to determine if recent slowdown of the US economy is a double dip or simply a temporary slowdown.

I put up some charts for some transportation stocks that might provide some signs on the future direction of the US economy. As seen from the updated charts below for these transportation stocks, some of them have already broke above the upper channel (red line).


Furthermore, the chart for the DJ Transportation index also shows it has closed at an all time high on Friday, July, 1, 2011, and the Dow Theory has spoken.


Although the DJ Industrial index did not close at a new high above its April 29, 2011 close, but this non-confirmation signaled by the Dow Theory indicates a new high for the DJ Industrial is yet to come.


The significance of the new closing high from the DJT is it is an indication the recent slowdown in the US economy could turn out to be only temporary; ‘slow patch’. When the DJ Industrial index confirms with the DJ Transportation index, then a strong case can be made that the US economy is on a road to recovery. Until then, I will keep watching for the next Dow Theory signal with a bullish bias for the intermediate term.


Share It

Thursday, June 30, 2011

MRVL - Long (6/30/2011)

The results from yesterday's breakout watch post are:

- HPQ gap up and ran off. Skip this setup and wait for next setup.
- RIMM stayed home and made little progress toward breakout level. Continue watch.
- MRVL moved above breakout level 14.54 and initiated a swing long.


MRVL:

A swing long position was initiated as the price of MRVL moved above 14.54. Keeping this trade tight by setting the stop to breakeven level after the intraday price has reached 14.78. This trade is now a risk free trade. Here is the daily price chart showing today's move.


HPQ:

HPQ opened with a gap up. There was news on possible breaking up the company by PE buying pieces of the company. Today's price action formed a shooting star candle which can result in a reversal move. Will pass on this setup and wait for the next setup.


Disclosure: long MRVL


Share It

Coming Out Of The Dog House

Here are three stocks that appear to be coming out of the dog house: MRVL, HPQ, and RIMM. The following charts highlight potential breakout and potential upside level.


Disclosure: no position


Share It

Tuesday, June 28, 2011

Silver Watch

Silver appears to be coming down to test the $33 an ounce level once again. If it breaks below this level, it can very well be headed down to the $26 level this time.


Share It

Sunday, June 26, 2011

Double Dip

Recently, the phrase “double dip” started to be heard once again as numerous economic reports showing signs the US economy is not recovering as expected. Even with the QE2 (time will tell if this is an ill conceived experiment), it did not help reduce the US unemployment rate or get the US GDP to grow at a level that will take the US economy out of the recession. Worst yet, $600B spent and no significant amount of new jobs were created.

Is the US economy moving toward a double dip recession? The answer depends on who you are listening to. In one camp, the talking heads blame the Japan earthquake, the tornados, and the rising oil prices for causing this temporary slowdown. And the opposite side is citing the massive liquidity the FED injected into the system via QE2 did nothing to promote business expansion, instead, it only fueled rising asset prices (stocks in particular) and rising commodities prices including the price for crude oil.

So who does the market believe? Looking at the Dow Jones Industrials index, it appears it is heading down in anticipation of a slowing economy.

DJI:


But the Dow Jones Transportation index is showing some hesitation in agreeing with the DJI. The DJI is nearing a breakdown to test its 200 SMA, while the DJT is above its supporting trendline and the 200 SMA, and it could be setting up to move back to the May, 2011 level.

DJT:


Some might point out the recent strength of the DJT could be due to falling crude oil prices. To gauge the future strength of the DJT is due to the improving manufacturing sector and not primarily due to falling crude oil prices, keep an eye on some of the rails and shipping stocks. Watching how some of these transportation stocks perform in the coming weeks will give us a better picture on whether a double dip is real or the recent slowdown in the US economy is temporary.

JBHT, NSC, UNP, CNW, CHRW, CSX:


If the price of these stocks breaks below the support level indicated by the line drawn in black, then double dip could be in the card. But if the price of these stocks breaks above their recent high, indicated by the red line, then this slowdown could be temporary. While the talking heads debate on the double dip or no double dip, I will be keeping an eye on these transportation stocks and pay attention to the market when the Dow Theory speaks.


Share It

Thursday, June 23, 2011

A Dead Cat Bounce?

Is the recent market bounce a dead cat bounce? After the SP500 being up for four consecutive days, it experienced a down day with a loss of 0.65%, or 8.38 points. The Nasdaq 100 and the Dow Jones Industrial incurred similar losses. Unless these market indices can hold above their recent pivot low, then this brief up trend could turn out to be a dead cat bounce.


SP500:


Nasdaq 100:


When a market leader such as AAPL starts to break down, it doesn’t instill confidence for the bulls to step up. If AAPL break down from the descending price channel and move below 310, a price below 300 could be very probable.


Until the market has shown sign of a reversal, such as a new higher high/higher low, I will either move to the sideline or look for short setups.


Share It

Friday, June 17, 2011

Unthinkable

Unthinkable to see the SP500 experiencing a seven consecutive down weeks? Take a look at this chart.


The last time SP500 experienced a seven weeks losing streak was in 2/11/1980. During that span of seven down weeks, the SP500 had a 21.6% loss.

And if you think seven consecutive weeks is bad enough, take a look at this chart showing a eight weeks consecutive losses for the SP500.


This eight consecutive weeks of losses occurred in 1/29/2001 (oh how soon we forget...the dot com bust). This losing streak also incurred a 21.8% loss.

The current seven consecutive weeks of losses (pending a less than 3.34 points gain on 6/17/2011) only incurred approximately 8% of losses at the close of 6/16/2011. If this losing streak incurs the same percentage of losses as previous losing streaks, the SP500 will be near 1075. So keep an eye on the 1050 support level if this market get ugly.


Share It

Sunday, June 12, 2011

Beware Of The Obvious

Looking at the latest SP500 daily price chart and the level near 1250 stick out as a potential support. Many market participants will be looking for a bounce when it gets near the 1250, but beware of the obvious. The market rarely do what the masses expect it to do. Click on the following chart for the SP500 and see where it might find support if it fails to bounce when it reaches 1250.


Share It

Monday, June 6, 2011

Testing Time

It's testing time once again for the market. After the SP500 failed to hold above the 1345 level, it reversed and broke below the descending price channel and facing a test for support near 1294. If it fails to find support at this level, then the next likely level for support will be near 1276. Until it breaks below 1240-1250, it still confine inside the long term ascending price channel.

SP500 daily:


SP500 30 minutes intraday:


SP500 weekly:


The Nasdaq 100 is also facing a test for support near the 2265-2275 region after it has made an upward move to fill the recent down gap and failed to move above the 2375 level.

Nasdaq 100:


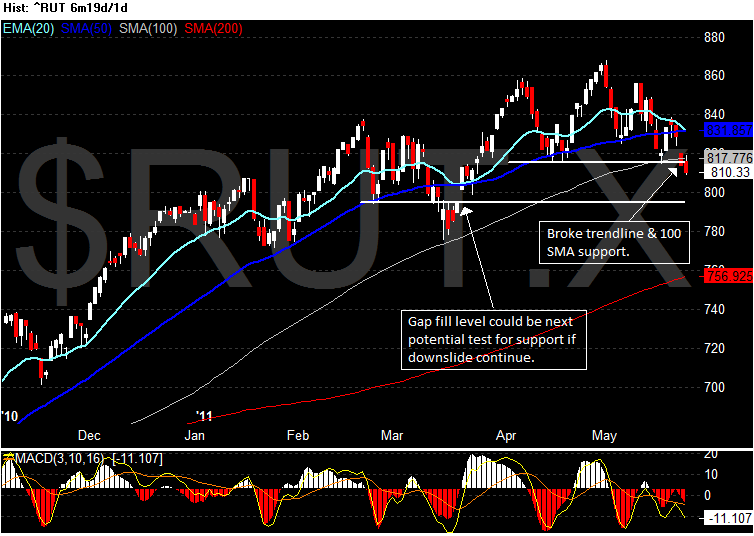
The Russell 2000 made a higher high toward the 850 level only to find itself reverse back down to recent pivot low near the 807 level. If it fails to hold above the 807 level, then look for it to go down to fill the March down gap and to 770 for possible support.

Russell 2000:


Share It

Wednesday, June 1, 2011

QCOM - Swing Trade (5/26/11 - 6/1/11)

One of my trading style is to play for the breakout, which is different than the style of trading the breakout.

For this trade, QCOM has been consolidating under a declining trendline of a wedge (lower trendline omitted). On 5/26/11, a long position was entered after it has bounced off the 20 EMA and moved above the 56.96 level with the initial stop loss level set beneath the 20 EMA. The first profit target is the last pivot off the trendline at 58.46, and the objective target is the high near the beginning of March, 2011 at 59.84. These trading levels will provide the 2:1 R/R.

When the market reopen after the long Memorial Day holiday, QCOM broke above the trendline and the position was scaled out as the price crosses the first profit target level of 58.46. After reaching the first profit target, the stop level is moved slightly above the entry price level to prevent a profitable trade turned into a losing trade, and also to lock it additional profit.

Today, June 1, 2011, market open in a slight negative tone. When the ADP and the ISM numbers came out that fell short of expectations, the market sold off and QCOM was no exception. As it tried to hold above the stop level throughout the session, it finally gave in on late afternoon and the stop was hit and the position was closed out.

Here is the chart showing the various levels and commentary for this trade (click on it to view a larger image of the chart.)


Share It

Monday, May 30, 2011

Showing Signs

The month of May is coming to an end and the market indices are showing signs of regaining supports, and they appear to be setting up for the next potential uptrend.

Here are the updated charts for the SP500, Nasdaq 100, and the Russell 2000.

SP500:


Nasdaq 100:


Russell 2000:


Share It

Wednesday, May 25, 2011

Russell In Trouble

The Russell 2000 broke below its trendline support and its 100 SMA near the 816 level, and this could spell trouble. Next likely test for support will be the March 2011 gap at 795.


The SP500 came within 0.11 point on filling its April 2011 gap. If it doesn't close above the 100 SMA, look for 1295 to be the next likely level to test for support.


The Nasdaq 100 filled its April 2011 gap and next potential support will be near the 2255-2260.


Share It

Sunday, May 22, 2011

Critical Watch

The market is at a crossroad once again. After OpEx week, the major market indices are at a point where they will either resume it ascend to newer high or face a critical test of support near major moving averages. If the indices failed to hold support, it could be the start of a new down trend. While the market is under critical watch, I will continue to be on the sideline.

Here are the updated charts, click on them to view a larger image and to read the commentary.

SP500:


Nasdaq 100:


DJIA:


Russell 2000:


Share It

Monday, May 16, 2011

Trying To Catch A Second Wind

The market is appearing to be running out of breath and trying to catch a second wind. The SP500 has found temporary support near a supporting trendline. But the recent downside momentum might push this index down to test the 100 SMA for support and to fill the 4/20/2011 opening gap near 1312 level.


The tech heavy Nasdaq 100 was dragged down by AAPL & GOOG, both of them were down more than 2% today. This index is trying to hold support at the 50 SMA, and it’s only about 26 points away from filling the 4/20/2011 opening gap near 2306. Having a supporting trendline crossing the 2306 gap level, the 2306 will act as a magnet to pull this index to fill the gap.


Until the market re-establish support or made a clear break on the downside, I will be on the sideline.


Share It

Wednesday, May 11, 2011

YOKU - 5/11/2011 (Stopped Out)

YOKU - 5/11/2011 update

The swing long trade initiated on 5/6/2011 with the setup of bouncing off supporting trendline and the 20 EMA failed to gain upside momentum. Today, the price declined below the stop loss level and the trade was closed out with a 1R loss when it hit the stop loss level. With the price moving below the previous low, it is now forming a lower-high/lower-low downward trend. Until this price pattern reverses, no new long position will be considered.


Share It

Saturday, May 7, 2011

YOKU - 5/6/2011 (Long)

YOKU - 5/6/2011

Here is my first trade on this China internet stock YOKU that went IPO last December. The setup is based on the bounce off support trendline and the 20 EMA. A swing long position was initiated on 5/6/2011. Click on the image to view the commentary and the various exit levels planned for this trade. I will post updates for this trade as it moves along.


Disclosure: long on YOKU.


Share It

Thursday, May 5, 2011

The Falling Knife

Yesterday the price of the silver ETF, SLV was near a potential support level of 37 and its 50 SMA. When SLV open for trading today, it gapped down to open at 36.53 and made a feeble attempt to retrace to test the 37 for resistance. After retracing only to the level of 36.89, it resumes its decline to the mid 33 and finally halted the decline for the day when it touches the 100 SMA.

When the price drop like a falling knife, it is best to avoid the temptation to bottom fishing. Otherwise, one’s trading account can get cut up very quickly. For now, even if SLV finds support at 33, I will wait until it has bounced off the support before considering taking any position on it.


Share It

Wednesday, May 4, 2011

Same Old Game

This is the same old game being played over and over again. Whenever a market gets too speculative (one sided), the margin is raised to take out the excess. This is exactly what has happened to the silver market this week. The CME increased the margin and triggered a sell off on silver. This in turn triggers a sell off on the silver ETF, SLV. As the price continue to fall, it triggers more margin call selling, and that forces liquidation to take place on other assets to cover margin call and losses.

Since the price of silver has fallen, the SLV has fallen more than 20% in less than a week from a high of 48.35 on 4/28/11 to today’s intraday low of 38.01. Now that silver has dropped more than 20%, what's next?

Looking at the price chart of SLV, there could be an oversold bounce when it hit a potential support near 37. This is a previous resistance level when SLV was on the way up, and it is also near the 50% Fibonacci retracement level between the 4/28/11 high and the 1/25/11 low. Furthermore, the price is near the 50 SMA and when it moves below the 50 SMA, a test on moving back above this moving average is not unusual. The bottom line is, it’s a bit late to initiate new shorts, and too risky to go long. I would watch for a bounce back up to the 40 level and see how the price holds up, then I will look for long or short entry.


Share It