Friday, June 17, 2011

Unthinkable

Unthinkable to see the SP500 experiencing a seven consecutive down weeks? Take a look at this chart.


The last time SP500 experienced a seven weeks losing streak was in 2/11/1980. During that span of seven down weeks, the SP500 had a 21.6% loss.

And if you think seven consecutive weeks is bad enough, take a look at this chart showing a eight weeks consecutive losses for the SP500.


This eight consecutive weeks of losses occurred in 1/29/2001 (oh how soon we forget...the dot com bust). This losing streak also incurred a 21.8% loss.

The current seven consecutive weeks of losses (pending a less than 3.34 points gain on 6/17/2011) only incurred approximately 8% of losses at the close of 6/16/2011. If this losing streak incurs the same percentage of losses as previous losing streaks, the SP500 will be near 1075. So keep an eye on the 1050 support level if this market get ugly.


Share It

Sunday, June 12, 2011

Beware Of The Obvious

Looking at the latest SP500 daily price chart and the level near 1250 stick out as a potential support. Many market participants will be looking for a bounce when it gets near the 1250, but beware of the obvious. The market rarely do what the masses expect it to do. Click on the following chart for the SP500 and see where it might find support if it fails to bounce when it reaches 1250.


Share It

Monday, June 6, 2011

Testing Time

It's testing time once again for the market. After the SP500 failed to hold above the 1345 level, it reversed and broke below the descending price channel and facing a test for support near 1294. If it fails to find support at this level, then the next likely level for support will be near 1276. Until it breaks below 1240-1250, it still confine inside the long term ascending price channel.

SP500 daily:


SP500 30 minutes intraday:


SP500 weekly:


The Nasdaq 100 is also facing a test for support near the 2265-2275 region after it has made an upward move to fill the recent down gap and failed to move above the 2375 level.

Nasdaq 100:


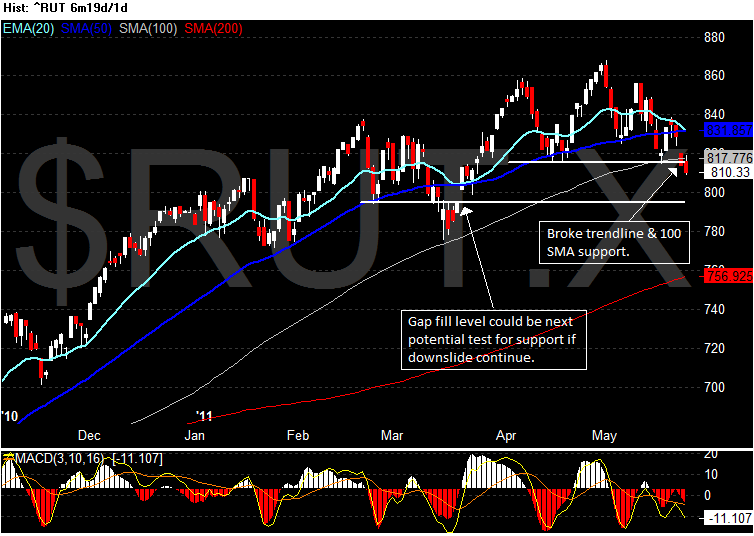
The Russell 2000 made a higher high toward the 850 level only to find itself reverse back down to recent pivot low near the 807 level. If it fails to hold above the 807 level, then look for it to go down to fill the March down gap and to 770 for possible support.

Russell 2000:


Share It

Wednesday, June 1, 2011

QCOM - Swing Trade (5/26/11 - 6/1/11)

One of my trading style is to play for the breakout, which is different than the style of trading the breakout.

For this trade, QCOM has been consolidating under a declining trendline of a wedge (lower trendline omitted). On 5/26/11, a long position was entered after it has bounced off the 20 EMA and moved above the 56.96 level with the initial stop loss level set beneath the 20 EMA. The first profit target is the last pivot off the trendline at 58.46, and the objective target is the high near the beginning of March, 2011 at 59.84. These trading levels will provide the 2:1 R/R.

When the market reopen after the long Memorial Day holiday, QCOM broke above the trendline and the position was scaled out as the price crosses the first profit target level of 58.46. After reaching the first profit target, the stop level is moved slightly above the entry price level to prevent a profitable trade turned into a losing trade, and also to lock it additional profit.

Today, June 1, 2011, market open in a slight negative tone. When the ADP and the ISM numbers came out that fell short of expectations, the market sold off and QCOM was no exception. As it tried to hold above the stop level throughout the session, it finally gave in on late afternoon and the stop was hit and the position was closed out.

Here is the chart showing the various levels and commentary for this trade (click on it to view a larger image of the chart.)


Share It

Monday, May 30, 2011

Showing Signs

The month of May is coming to an end and the market indices are showing signs of regaining supports, and they appear to be setting up for the next potential uptrend.

Here are the updated charts for the SP500, Nasdaq 100, and the Russell 2000.

SP500:


Nasdaq 100:


Russell 2000:


Share It

Wednesday, May 25, 2011

Russell In Trouble

The Russell 2000 broke below its trendline support and its 100 SMA near the 816 level, and this could spell trouble. Next likely test for support will be the March 2011 gap at 795.


The SP500 came within 0.11 point on filling its April 2011 gap. If it doesn't close above the 100 SMA, look for 1295 to be the next likely level to test for support.


The Nasdaq 100 filled its April 2011 gap and next potential support will be near the 2255-2260.


Share It

Sunday, May 22, 2011

Critical Watch

The market is at a crossroad once again. After OpEx week, the major market indices are at a point where they will either resume it ascend to newer high or face a critical test of support near major moving averages. If the indices failed to hold support, it could be the start of a new down trend. While the market is under critical watch, I will continue to be on the sideline.

Here are the updated charts, click on them to view a larger image and to read the commentary.

SP500:


Nasdaq 100:


DJIA:


Russell 2000:


Share It

Monday, May 16, 2011

Trying To Catch A Second Wind

The market is appearing to be running out of breath and trying to catch a second wind. The SP500 has found temporary support near a supporting trendline. But the recent downside momentum might push this index down to test the 100 SMA for support and to fill the 4/20/2011 opening gap near 1312 level.


The tech heavy Nasdaq 100 was dragged down by AAPL & GOOG, both of them were down more than 2% today. This index is trying to hold support at the 50 SMA, and it’s only about 26 points away from filling the 4/20/2011 opening gap near 2306. Having a supporting trendline crossing the 2306 gap level, the 2306 will act as a magnet to pull this index to fill the gap.


Until the market re-establish support or made a clear break on the downside, I will be on the sideline.


Share It

Wednesday, May 11, 2011

YOKU - 5/11/2011 (Stopped Out)

YOKU - 5/11/2011 update

The swing long trade initiated on 5/6/2011 with the setup of bouncing off supporting trendline and the 20 EMA failed to gain upside momentum. Today, the price declined below the stop loss level and the trade was closed out with a 1R loss when it hit the stop loss level. With the price moving below the previous low, it is now forming a lower-high/lower-low downward trend. Until this price pattern reverses, no new long position will be considered.


Share It

Saturday, May 7, 2011

YOKU - 5/6/2011 (Long)

YOKU - 5/6/2011

Here is my first trade on this China internet stock YOKU that went IPO last December. The setup is based on the bounce off support trendline and the 20 EMA. A swing long position was initiated on 5/6/2011. Click on the image to view the commentary and the various exit levels planned for this trade. I will post updates for this trade as it moves along.


Disclosure: long on YOKU.


Share It

Thursday, May 5, 2011

The Falling Knife

Yesterday the price of the silver ETF, SLV was near a potential support level of 37 and its 50 SMA. When SLV open for trading today, it gapped down to open at 36.53 and made a feeble attempt to retrace to test the 37 for resistance. After retracing only to the level of 36.89, it resumes its decline to the mid 33 and finally halted the decline for the day when it touches the 100 SMA.

When the price drop like a falling knife, it is best to avoid the temptation to bottom fishing. Otherwise, one’s trading account can get cut up very quickly. For now, even if SLV finds support at 33, I will wait until it has bounced off the support before considering taking any position on it.


Share It

Wednesday, May 4, 2011

Same Old Game

This is the same old game being played over and over again. Whenever a market gets too speculative (one sided), the margin is raised to take out the excess. This is exactly what has happened to the silver market this week. The CME increased the margin and triggered a sell off on silver. This in turn triggers a sell off on the silver ETF, SLV. As the price continue to fall, it triggers more margin call selling, and that forces liquidation to take place on other assets to cover margin call and losses.

Since the price of silver has fallen, the SLV has fallen more than 20% in less than a week from a high of 48.35 on 4/28/11 to today’s intraday low of 38.01. Now that silver has dropped more than 20%, what's next?

Looking at the price chart of SLV, there could be an oversold bounce when it hit a potential support near 37. This is a previous resistance level when SLV was on the way up, and it is also near the 50% Fibonacci retracement level between the 4/28/11 high and the 1/25/11 low. Furthermore, the price is near the 50 SMA and when it moves below the 50 SMA, a test on moving back above this moving average is not unusual. The bottom line is, it’s a bit late to initiate new shorts, and too risky to go long. I would watch for a bounce back up to the 40 level and see how the price holds up, then I will look for long or short entry.


Share It

Sunday, April 24, 2011

Clearing Out The Resistance

After the SP500 has moved back above the 1322, it appears to be clearing out the resistance near 1339. When the SP500 breaks above the February 2011 high of 1344.07, the next likely major target level for the SP500 will be near the 1430 region.

The 1430 level is from a confluence of the measured move from price patterns and the 2008 high. The SP500 price chart below highlight the various price patterns that created a confluence of targets near the 1430 region. The black baseline is the 5/19/2008 closing high of 1426.63. The red lines depict the cup & handle price pattern formed between April and December of 2010 with a measured move of 1428.69. The blue lines illustrate the recent inverted head & shoulder price pattern with a projected measured move of 1429.97.

SP500:


I will continue to focus on the longs until the market tell me otherwise.


Share It

Saturday, April 16, 2011

Getting Ready To Move

This post from 4/7/2011 identified some key support levels to monitor when a pullback occurs. From this week’s price actions, it appears the market did what it has indicated it might do.

The SP500 appears to have completed its pull back by dipping down to test the level near 1300. It has moved back above the 20 EMA and 50 SMA after it has dipped down to 1302 on an intraday basis. When the SP500 breaks above the 1322 level, which could be the signal it is ready to move to a new high above 1344.


The picture for the Nasdaq 100 is slightly different from the SP500. The Nasdaq 100 is still being drag down by AAPL and GOOG. Next week AAPL will be reporting its earnings, and that will probably create some volatility to pull the Nasdaq 100 down to the 2270 region. The semiconductor sector that has been contributing to the weakness in the Nasdaq 100 has turned to mixed. This could also be a sign that the Nasdaq 100 is also getting ready to move to higher level soon.


Although things are looking a bit more positive, but key support levels still need to be watched carefully in case some unexpected event or earnings surprises shake the market one more time before it resume its ascend. While waiting for the market to firm up once again toward the upside, I won’t be shorting this market. Instead, I will start identifying potential longs for the next up move.


Share It

Tuesday, April 12, 2011

JPM - Swing Long Exit (4/11/2011)

The swing long trade on JPM initiated on 3/29/2011 was closed out today. Click on this link to read the entire trade.


Share It

Sunday, April 10, 2011

Things To Watch

Until the end of QE2, the market will continue to move higher. Although the recent price actions showing the market is stalling (potential pull back), but the trend remain to be up. The things to watch as the market make its next move to higher level are the continuation of rising commodities prices due to weakening US dollar. And for the market to mount a rally with conviction, the financial and the tech sector will need to participate.

The ETFs to watch are MOO (commodities), GLD (gold), TBF (short US Treasury), UUP (US dollar), XLF (financial), and SMH (semiconductor). The weekly price chart for XLF show it is forming a cup and handle price pattern, while the weekly price chart for the semiconductor sector ETF, SMH show it is working on its weekly bull flag move.


GLD (gold):


MOO (commodities):


UUP (US dollar):


TBF (20+ yrs US Treas. Short):


XLF (financial):


SMH (semiconductor):


Share It

Thursday, April 7, 2011

Pullback Coming?

With the federal budget battle continuing and a potential government shut down, traders will most likely lighten up their positions going into the weekend to avoid potential ambush on Monday.

Here are some hourly intraday price charts highlighting some possible near term support levels for the SP500, Nasdaq 100 and the DJIA if a pullback occurs. Until some major support is broken or a climatic top has been formed, the intermediate trend remains to be up.

Note: The moving averages on the chart are 5 days SMA & 5 days EMA. Notice how they are flatten out and appear to be rolling over with prices moving beneath them.


SP500 hourly:


Nasdaq 100 hourly:


DJIA hourly:


Share It

JPM - Swing Long Update (4/7/2011)

Click here to see the latest update.


Share It

Wednesday, April 6, 2011

JPM - Swing Long Update (4/6/2011)

Stop has been moved to breakeven. See original post for updates.


Share It

Sunday, April 3, 2011

A Look At The Big Picture

The market appears to have developed some divergence and seems to be sending out mix messages. But looking at a longer time frame price chart, the market message continues to be bullish.

The following weekly price chart for various market indices give a good look at the big picture. The bullish message is emanating from the Dow Jones Transportation and the Russell 2000. The Russell 2000 is only 9 points from its all time closing high and less than 10 points from its all time high. Even with the recent rise in crude oil prices, the Dow Jones Transportation index is getting close to its 2007 high. All these are signs of a higher high for the Dow Jones Industrials, SP500, and the Nasdaq 100.

By no means that there isn’t any short term weakness to be on the lookout for. One obvious weakness is in the tech heavy Nasdaq 100. The Nasdaq 100 is being dragged down by the weakness in the semiconductor sector and the price action of AAPL. While these weaknesses being resolve, I remain to be bullish.

Russell 2000:


Dow Jones Transportation:


SP500:


Nasdaq 100:


DJI:


NYA:


Share It