The market continues to move higher and just won't let the bears escape. It teases the bears by continually doing small sell off just to lure them to short into this market, then the market reverses and move higher to trap them bears. The SP500 is near breaking above the 1370. After breaking above the 1370, the next major resistance level will likely be 1425 near the 2008 high.
Here is a video highlighting the possible level for the SP500, and three stocks; VRSN, SNDK, and AA that are breaking out of its base.
Click on the full screen icon to view the video in HD.
Here is the link for the video.
Disclosure: long on VRSN, SNDK, AA
Thursday, February 23, 2012
Saturday, February 18, 2012
AAPL (2/18/2012)
A quick look at AAPL to see what it might do in the near term.
click on the full screen icon to view it in HD.
Direct link to video or go to www.lastchipstanding.com
click on the full screen icon to view it in HD.
Direct link to video or go to www.lastchipstanding.com
Share It
Tweet

Sunday, February 12, 2012
Pull Back Or Not
During the end of last week, the market shown some signs of fatigue and gave up some of the previous gains. But looking at the intraday chart, one can also see there seems to be some buying into the close. This minor pullback the market did could due to the weekly options expiration. From the price action of the SP500, it has not indicate it will pullback to below 1300. But anything is possible, and until it has retreated below 1300, I will continue to trade as the trend is still 'up'.
Here is a short video reviewing the SP500. Click on the 'full screen' icon to view it on HD. And for those email subscribers that do not see the video player on their screen, please click on this link or go to www.lastchipstanding.com to view the video.
Here is a short video reviewing the SP500. Click on the 'full screen' icon to view it on HD. And for those email subscribers that do not see the video player on their screen, please click on this link or go to www.lastchipstanding.com to view the video.
Share It
Tweet
Monday, February 6, 2012
P - A Look At Pandora (2/6/2012)
From the recent Facebook IPO filing hype, here is a brief look at some potential trading opportunities for Pandora - P
click on the full screen icon to view it in HD.
For email subscribers, click here to view the video.
click on the full screen icon to view it in HD.
For email subscribers, click here to view the video.
Share It
Tweet
Sunday, February 5, 2012
GS - Swing Levels Video
A short screencast video at StockTwits on GS. Click here to view the video to see what are some of the potential swing trade levels.
Share It
Tweet
BAC, HPQ, DELL, MCP, AVL, PHM (2/5/2012)
The market continues to remain strong, and here is a short video reviewing a few stocks I have mentioned earlier: BAC, HPQ, DELL, MCP, AVL, PHM.
Click the full screen icon on the video player to watch it in HD.
Click here if you need to go directly to the video.
Click the full screen icon on the video player to watch it in HD.
Click here if you need to go directly to the video.
Share It
Tweet
Wednesday, January 25, 2012
AAPL & SP500 (1/25/2012)
AAPL continue to surprise the market with a blowout earnings report. The SP500 continue to head toward the 2011 high.
The follow video is a brief look at AAPL, the SP500 and couple of rare earth stock, AVL & MCP.
Here is the video link for the email subscribers.
The follow video is a brief look at AAPL, the SP500 and couple of rare earth stock, AVL & MCP.
Here is the video link for the email subscribers.
Share It
Tweet
Monday, January 23, 2012
AAPL HPQ DELL (1/23/2012)
A quick look at AAPL one more time before tomorrow's earnings report, and a look at two PC stock, HPQ & DELL that appear to be setting up for a breakout.
For the email subscribers, here is the links for you to view the video.
For the email subscribers, here is the links for you to view the video.
Share It
Tweet
Sunday, January 22, 2012
AAPL (1/22/2011)
AAPL is due to report earnings after the close next Tuesday. The video show what AAPL's price movement might be prior to and after its earnings report.
For those subscribers that cannot see the video in their email, here is the link for the video or go to this blog's homepage.
For those subscribers that cannot see the video in their email, here is the link for the video or go to this blog's homepage.
Share It
Tweet
Wednesday, January 18, 2012
Pullback Watch
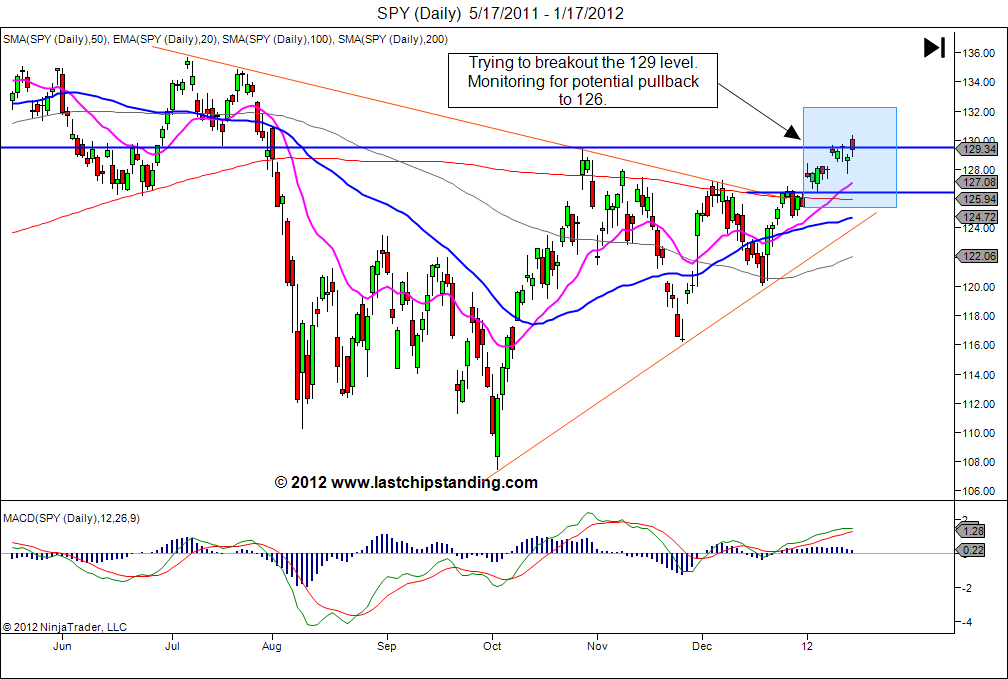
After the first 2 weeks of trading in the new year, the market appears to be a bit extended and readying to some consolidation. Be prepare for some wild move since this week is OpEx.
Here are the charts for the SP500, Nasdaq 100, and their respective ETF, SPY & QQQ.
Click on the image to get an enlarged view of the chart.
SP500

SPY

Nasdaq 100

QQQ

Here are the charts for the SP500, Nasdaq 100, and their respective ETF, SPY & QQQ.
Click on the image to get an enlarged view of the chart.
SP500

SPY
Nasdaq 100

QQQ

Share It
Tweet
Wednesday, January 11, 2012
SP500 - 1/10/2012
(click on the 'full screen' and select the 720 to view in HD)
For those email subscribers that did not get the video player link, click on this link or go to www.lastchipstanding.com to view the video.
For those email subscribers that did not get the video player link, click on this link or go to www.lastchipstanding.com to view the video.
Share It
Tweet
Tuesday, January 3, 2012
Happy New Year
Happy New Year everyone.
In 2012, I will start making some video post. Here is the first video post for the new year. This video is about a swing long setup for BAC.
In 2012, I will start making some video post. Here is the first video post for the new year. This video is about a swing long setup for BAC.
Share It
Tweet
Thursday, December 22, 2011
Happy Holiday!
Looks like Santa Claus is bringing the bulls a present for the holiday by having the SP500 breaks out of the wedge and move back above the 1260 level. The daily chart for the SP500 shows the recent price actions seem to favor an upside breakout.

As another possible holiday gift, the battered financial sector finally showing some upside bids and could be setting up to reverse its downward trend (see the chart for ETF, XLF below.)

And not to overlook the homebuilders, they too are showing some sign of upside price trend. Take a look at the price chart for the homebuilders ETF, XHB.

Finally, Santa did not forget AAPL. It too has moved above the baseline near 396 and appears to be making a move back above the 400 level.

If these price actions hold up and the SP500 stays above 1260, then the SP500 could end the year 2011 in the green.
Have a happy holiday!
Disclosure: long on AAPL

As another possible holiday gift, the battered financial sector finally showing some upside bids and could be setting up to reverse its downward trend (see the chart for ETF, XLF below.)

And not to overlook the homebuilders, they too are showing some sign of upside price trend. Take a look at the price chart for the homebuilders ETF, XHB.

Finally, Santa did not forget AAPL. It too has moved above the baseline near 396 and appears to be making a move back above the 400 level.

If these price actions hold up and the SP500 stays above 1260, then the SP500 could end the year 2011 in the green.
Have a happy holiday!
Disclosure: long on AAPL
Share It
Tweet
Monday, December 12, 2011
Still Waiting...
The market still have not made a decisive move in either direction. Another OpEx week is upon us, and likely we will see additional volatility while we wait for the market to choose a direction.
Here are the updated charts, click on them to read the commentary:
DJIA:

SP500:

Nasdaq 100:

Here are the updated charts, click on them to read the commentary:
DJIA:

SP500:

Nasdaq 100:

Share It
Tweet
Monday, December 5, 2011
GLD, SLV & AAPL update
Latest updates for GLD, SLV & AAPL.
Click on the chart to get a larger view to read the commentary.
GLD:

SLV:

AAPL:

Click on the chart to get a larger view to read the commentary.
GLD:

SLV:

AAPL:

Share It
Tweet
Sunday, December 4, 2011
Holiday Cheers
Just when one think the market is heading one way, some tricky appears and move it to the opposite direction. Whether it was the encouraging Black Friday shopping results or the European/Central Banks trickery, the market definitely has bought the holiday cheers to the bulls.
The SP500 has bounced off the 200 SMA and it is testing the 1260 (H&S neckline) once again. Although it printed a shooting star candle pattern on Friday, any consolidation under the 1260 at this point could simply be building up more momentum for a surge above the neckline and move into the 1300 territory.

The DJIA printed a doji while sitting on the 200 SMA. This index can be setting up for a move above the 12300 level.

The Nasdaq 100 20 EMA, 50/100/200 SMA are all converging with the price near the convergent point. It is sitting in the middle of the triangle with a rising MACD. These technical signs indicate potential further upside and can leads to upward move above 2400.

Finally, the Russell 2000 is bumping up against the 738 resistance and the upper trendline of the triangle price pattern. When it breakout of this price pattern, it could potentially move to test the 200 SMA near the 773 level.

The SP500 has bounced off the 200 SMA and it is testing the 1260 (H&S neckline) once again. Although it printed a shooting star candle pattern on Friday, any consolidation under the 1260 at this point could simply be building up more momentum for a surge above the neckline and move into the 1300 territory.

The DJIA printed a doji while sitting on the 200 SMA. This index can be setting up for a move above the 12300 level.

The Nasdaq 100 20 EMA, 50/100/200 SMA are all converging with the price near the convergent point. It is sitting in the middle of the triangle with a rising MACD. These technical signs indicate potential further upside and can leads to upward move above 2400.

Finally, the Russell 2000 is bumping up against the 738 resistance and the upper trendline of the triangle price pattern. When it breakout of this price pattern, it could potentially move to test the 200 SMA near the 773 level.

Share It
Tweet
Sunday, November 27, 2011
Santa Claus Rally…
From the latest daily chart for the SP500, the price actions show no sign of a Santa Claus rally is to occur soon. After couple failed attempts to move above the H&S neckline, the SP500 has dropped back into the 1101-1200 trading range. With declining 50/100/200 SMA and a declining 20 EMA, any rally will likely to be short lived and will likely encounter resistance at one of the moving average or the upper bound of the trading range near 1220.


Share It
Tweet
AAPL At A Crossroad
Two weeks ago AAPL broke below 391 and it was trying to hold the 100 SMA for support. After a brief chop near the 100 SMA, it has broken down and dropped to the 200 SMA near the 363 level. AAPL is currently at a crossroad, it is sitting on a supporting trendline that is confluence with the current 200 SMA level (blue line), and this could potentially provide a short term bounce or a level for reversal. In order for the trend to reverse, AAPL needs to move back above the level near 378 (horizontal blue line). But looking at the 354-360 S/R (support/resistance) zone and the long support trendline from the March 2009 low, it is most likely the algor computers and the technical traders are waiting for AAPL to break below the 200 SMA and hit the long term support trendline near 354. If AAPL doesn’t set off a reversal near 354, then 325 is the next potential level for support. Until then, staying on the sideline and watching AAPL price action is probably the most prudent thing to do.
(click on the chart to get a larger view)

(click on the chart to get a larger view)

Share It
Tweet
Sunday, November 13, 2011
Fallen AAPL
The table seems to have been turned for AAPL. The week that just passed, AAPL has been the laggard stock. While the market continues to hold its ground and consolidate in preparation for a move to higher level, AAPL has headed down.
The chart of AAPL below show how the volume has increased when it broke below the 391 level.

Although it has bounced off the 100 SMA, the key level to watch is the broken support level of 391. If it is unable to move back above 391 and breaks below the 100 SMA, then the next potential support for AAPL could be near the 200 SMA (around the 360 region). I will be monitoring the price actions for possible swing long to 409 when it reclaims the 391 level.
Disclosure: short on AAPL PUT.
The chart of AAPL below show how the volume has increased when it broke below the 391 level.

Although it has bounced off the 100 SMA, the key level to watch is the broken support level of 391. If it is unable to move back above 391 and breaks below the 100 SMA, then the next potential support for AAPL could be near the 200 SMA (around the 360 region). I will be monitoring the price actions for possible swing long to 409 when it reclaims the 391 level.
Disclosure: short on AAPL PUT.
Share It
Tweet
Sunday, November 6, 2011
Continue To Consolidate
The market continues consolidating near prior resistance. The DJIA held the 11600 support and it is consolidating above the 11897 level before making another attempt to break the 12385 level.

The SP500 came down and retested the 1220 for support and now it is attempting to break above the 1260 H&S neckline once again.

The Nasdaq 100 has been consolidating between the 200 SMA and the 2368 resistance. It looks more of ‘when’ rather than ‘if’ it will break toward a new 52 week high above 2438.

The Russell 2000 also has been holding up well, and it appears to be in position to continue it upward move.

GLD, the gold ETF is continue to gap up toward filling the 173 gap.

Silver ETF, SLV appears it will not give up on filling the September gap. Watch for possible squeeze when it breaks above the gap and make a move toward 38.

AAPL has been consolidating between 391 and 409. A shakeout near 391 could occur before it goes on breaking the 409 baseline. If that occurs, it could present a nice swing trade to 409. Continue to monitor 391 and 409 price level.


The SP500 came down and retested the 1220 for support and now it is attempting to break above the 1260 H&S neckline once again.

The Nasdaq 100 has been consolidating between the 200 SMA and the 2368 resistance. It looks more of ‘when’ rather than ‘if’ it will break toward a new 52 week high above 2438.

The Russell 2000 also has been holding up well, and it appears to be in position to continue it upward move.

GLD, the gold ETF is continue to gap up toward filling the 173 gap.

Silver ETF, SLV appears it will not give up on filling the September gap. Watch for possible squeeze when it breaks above the gap and make a move toward 38.

AAPL has been consolidating between 391 and 409. A shakeout near 391 could occur before it goes on breaking the 409 baseline. If that occurs, it could present a nice swing trade to 409. Continue to monitor 391 and 409 price level.

Share It
Tweet
Subscribe to:
Posts (Atom)