Sunday, September 25, 2011

A Precursor

Last week, the SP500 went from the top of the trading range to the bottom of the trading range, a move of more than 100 points. At the same time, the gold and silver market also took a dive. Gold drop more than $175 and silver loss more than $10. These moves could be a precursor to an extended downward move.

In the coming week, the key thing to watch is will the SP500 bounce back to the top of the trading range near the 1220 or will it break below the lower range and dip below the 8/9/2011 low of 1101.54. If the SP500 fails to hold above 1101, then a new downward move will take this index to the 1040 level.

SP500:


SP500 (30 minutes intraday):


Gold could also get a bounce. Looking at the gold ETF, GLD could get a bounce between the 50 & 100 SMA. The key level to monitor is the 100 SMA. If it breaks below the 100 SMA, look for next likely support near 151.50.

GLD:


Silver ETF, SLV next likely support level is near 27.25. It broke below the previous support level near 32.50 and made a feeble attempt to try to get back above it without any success.

SLV:


All three markets had a down week and a dead cat bounce from these markets next week will not be surprising. But the trend remains to be down, and the current environment is most suitable for the day/short term traders.

Disclosure: No position in GLD, SLV.


Share It

Tuesday, September 20, 2011

SP500 - 1220 Level

Here is the updated SP500 30 minutes intraday chart. The SP500 bump against the 1220 resistance today and reversed. Key level for the bulls to defend tomorrow is the 5 days EMA near 1200.

SP500 (30 minutes):


Share It

Sunday, September 18, 2011

SP500 Update

The 30 minutes intraday chart of the SP500 depicts how it has been trading within the 1120-1220 range since the beginning of August. It formed a double bottom pattern in August and it was unable to break out of this pattern. After the failed breakout, the bears pushed it back down to the 1140 level when the bulls attempt to take it back above the 1120 1220 level. In the last trading session, the bulls finally were able to push above the 1120 1220 level once again. If the bulls can hold the SP500 above the 1120 1220 and move it beyond the 1130 1230 level, the head & shoulder baseline of 1260 could be the near term upside target once again.

Here are the levels to monitor for the coming week:

Upside: 1220, 1230 then 1260/1270
Downside: 1180 then 1140


SP500:


note: corrected reference levels typo (9/20/11)


Share It

Saturday, September 17, 2011

A Change In The Market

The SP500 has been chopping around within a range of 1120-1220 and it appears went nowhere. But if one look at various sectors within the market, one could sense the market’s characteristic is changing, at least for the near term. This change does not imply the market is reversing direction and heading toward a new bull trend. But the price actions of the sector ETFs shown on the following chart are signaling a possible near term rally could be in the offing. Unless something unexpected happen in the Euro zone, the market appears to have adjusted to whatever will most likely to occur.

(Click on the chart to get a larger view. The red lines are likely resistance & support levels)


Share It

Sunday, September 4, 2011

New High Coming For Gold & Silver?

Gold and silver held their ground after gapped up during the last trading session. There could be some retracement before they make an attempt to a new high.

GLD (Gold ETF):


GLD (30 minutes intraday):


SLV (Silver ETF):


Disclosure: Long on SLV


Share It

Wednesday, August 31, 2011

Moving Toward The Neckline

While market participants are waiting for the SP500 to come back down and test the 8/9/11 low of 1101.54, the index is making a turn toward the H&S neckline it has broken near the 1260 level.

Here are the updated price charts for the SP500 and its ETF, SPY.

SP500:


SP500 (30 minutes):


SPY:


SPY (30 minutes):


The 30 minutes intraday charts show there is a double bottom price pattern formed from recent price actions, and the measure move could push the SP500 and the SPY above the H&S neckline. If that happen, it is another reminder from the market to remind us don’t expect the expected (right now, lot of talking heads are staring at the 1260 level as the next possible resistance level.)


Share It

Sunday, August 28, 2011

Gold & Silver (GLD, SLV)

After the price of gold made a new high last Monday, it sold off and its ETF, GLD, dropped from a price near 185 to just below 166 in less than 3 trading sessions. Looking at the 30 minutes price chart for GLD, it shows the price moved below the 167.50 support level briefly. In the last trading session, GLD moved back above the previous R&S level near 175 and held above its 5 day SMA. If GLD continue to move up and break above the 181.60, it has the potential to make a newer high. But if it hit resistance between 175 and 182, lookout for a possible H&S pattern that could lead to lower prices.

GLD:


SLV:

Silver retraced along with the sell off on gold. The price of its ETF, SLV pulled back and filled the recent up gap and held above the 50 SMA. The daily price chart showing it could be getting ready for another move toward the 43.55 resistance level and possibly toward making a new high. The key support to watch for SLV will be its 50 SMA and the resistance level to watch is 43.55.


Unless GLD forms a head & shoulder pattern in its 30 minutes chart and SLV breaks below 50 SMA, the short term trend bias for these two shining metals is up.


Share It

Tuesday, August 23, 2011

Silver Pull Back

After 7 consecutive days of rising prices, profit taking finally hit this shining metal, silver. For those traders that went long when silver was hovering around the 20 EMA near the mid 38 level, taking some profit here seem to be a prudent thing to do.

This pull back in silver prices does not appears to be a trend reversal. The price actions still pointing toward potential higher prices until a technical breakdown has occurred to indicate otherwise. The level to watch for possible support for the silver future SI_F is near 40.40 and for the ETF, SLV is 39.30 (near their respective 20 EMA).

SI (silver future contract):


SLV (silver ETF):


Disclosure: No position.


Share It

Sunday, August 21, 2011

Silver On The Move

Silver is on the move once again after spending couple months building a base near the $33 area.

SI (Silver Future Contract):


Looking at its ETF price chart, it has formed a base near the 32.50 level. After having completed its test for support near the 36 level, it has broke above the previous pivot high of 41.73. This breakout appears to be forming a higher high/higher low price pattern that could lead to a new high.

SLV (Silver ETF):


Disclosure: Long on SLV


Share It

Attempt To Find Support

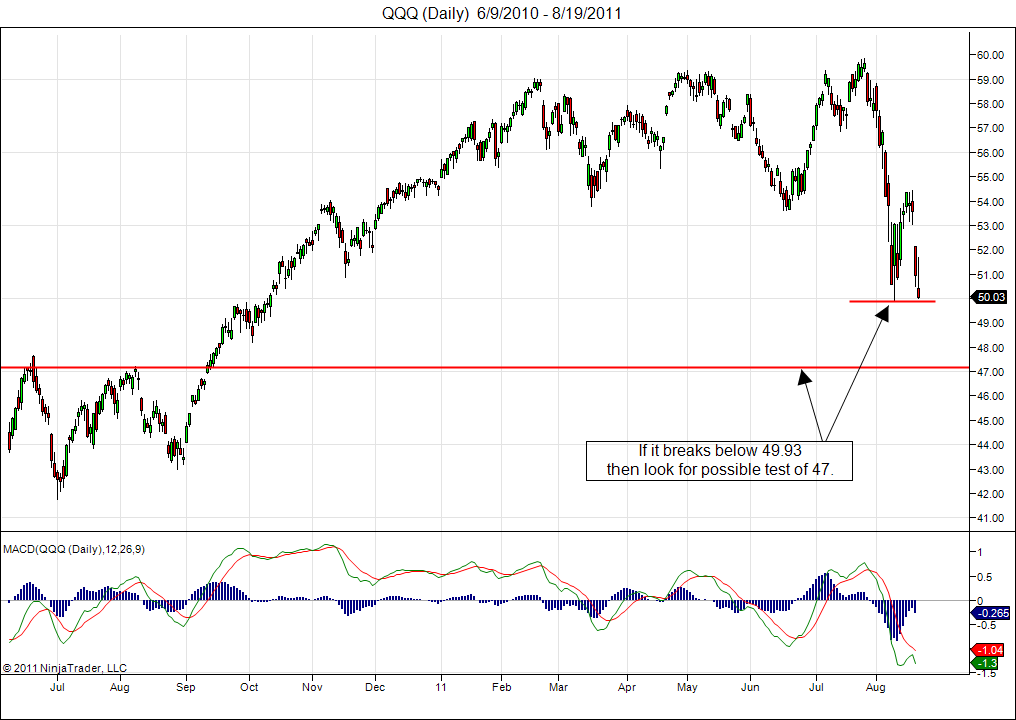
Last week, the major market indices bounced a bit then they resumed to their downward trend. As the OpEx week came to a close, these market indices sitting near their August low.

When the new trading week begins, look for the market to make an attempt on finding support near the August low. If it fails to hold above this low, then the likelihood for the market to dip into the support/resistance levels made in August 2010 is high.

This is a tricky period to initiate new shorts and definitely dangerous to go long. I will remain very cautious until the market either breaks below the August low or it has formed a short term reversal of higher low/higher high pattern.

Here are the updated charts highlighting some critical levels to monitor.

DJIA:


SP500:


SPY:


Nasdaq 100:


QQQ:


Share It

Sunday, August 14, 2011

More Volatility

Get ready for more volatility in the market after last week's wild ride. This week is another OpEx week and that usually create some volatility as various hedged positions unwind and/or rolled over.

During the recent market decline, the market has been very respectful to the technical levels. This seems to indicate majority of tradings are predominantly computer driven(HFT & Algor).

From the price actions shown in the charts below, a market rebound seem very likely. This rebound can take the indices back up to test the previously broken support level.

SP500:


SPX (SP500 ETF):


QQQ (Nasdaq 100 ETF):


IWM (Russell 2000 ETF):


I will not interpret this rebound to be a start of a new uptrend. Until the previous low has been tested and a period of consolidation has occurred, I will remain on the cautious side.


Share It

Tuesday, August 9, 2011

2008 Again?

Both, the 1105 support level and the 1170 resistance level I have posted for the SP500 in my previous post got hit within the last 70 minutes of trading today. Doesn't this remind you of 2008?

Take a look at these charts for the SP500 and the SP500 ETF, SPY.

SP500 (5 minutes intraday):


SPY:


If SPY can hold above the 117 level and continue to move higher, then the likely resistance level will be near the 120 area. And when it revert back below or can't hold above the 117 level, look for it to retrace to the potential support level of 110. If it fails to hold the 110 level, then this confirm today's rally is simply an oversold rally (or a short squeeze) and monitor the 105 level for possible support.


Share It

Monday, August 8, 2011

Violation

In less than a week, the SP500 violated all the identified technical levels (highlighted in blue, see chart below.)


Here are the next set of potential support and resistance levels. The key level to watch is 1040. If this level is broken, the SP500 could go below 1000 and things could get ugly.

SP500:


SPY:


Share It

Sunday, August 7, 2011

Read The Fine Prints (AAA or AA+)

Looking at Friday's close on the DJIA and the SP500, one would think the market is making a comeback. But if one pays attention to the market's breath and read the fine prints, then one would see there is nearly 1500 more declining issues than advancing issues and almost 700 issues made new lows in the NYSE. That is not a sign of a market making a comeback. Couple hours after the market closed, US got downgraded by S&P from AAA to AA+. Where is the market heading now? From the SP500 price chart, here are some possible levels it might reached in the near term (click on it to get a larger view):

SP500:


SPY (SP500 ETF):


Share It

Thursday, August 4, 2011

Blood On The Street

Blood is flowing on Wall Street today. Nothing was spared, including gold. It looks like the bleeding might not stop until the SP500 get near the 1150-1170 region.


The Head & Shoulder measured move put a target near 1144 if this price pattern plays out. Another possible support level is the minor support level near 1170 that was established back in Oct/Dec 2010. The most likely support level is the 61.8 Fib retracement level near 1150 from the impulse move between the low of July 2010 to the high of May 2011. Keep an eye on these level for possible support for the SP500 (click on the chart to get a larger view).


Share It

Wednesday, August 3, 2011

Head Fake or Dead Cat Bounce

Is today's price action a head fake or a dead cat bounce?

Lets take a look at the inflection point that the market has reached during the first few days of the week and some of the technicals that have converged.


The first and foremost is the formation of the head & shoulder price pattern. Yesterday, the market sold off and broke below the H&S neckline. Prior to breaking the H&S pattern, the SP500 gave up the 1296 level last Friday. And after an agreement on the US debt ceiling was reached over the weekend, the SP500 opened with a large gap up on Monday and faded until the ISM number came out. The fade became a sell off that continued into Tuesday when the SP500 broke below the H&S neckline. Today, the sell off continued with a break below the long term supporting trendline that was formed between the March 2009 low to the present. Then buyers stepped in when the SP500 dipped below 1235 and rallied to close slightly above the supporting trendline with a bullish long wick hammer candle.

So will the market continue to rise or will it resume its drop? From the standpoint that the market will frustrate maximum number of participants, it will do both.

One scenario is the market will continue with this dead cat bounce for a few days to generate a bit of bullishness. Then as quickly as the bullish sentiments started to settle in, a new round of selling will trigger to take the market down to the 1225-1228 level and forces the long overdue capitulation before the seasonal summer rally/back to school rally starts.

This scenario is just one possibility...remember, the market will do what it will do, not what we want it to do! We trade base on what we see, not what we hope.


Share It

Sunday, July 31, 2011

Debt Ceiling

As of this writing, a deal was struck between the two political parties in Washington to increase the US debt ceiling and the SP500 future is rallying by adding more than 1%, +15.70. If the gains on the future hold up, a strong opening in New York will likely to occur. But don't let the euphoria take your eyes off the key technical levels. For the cash index, it must recapture and hold above 1295.92, and to close above Friday's high of 1304.16. And for the SPY (SP500 ETF), it must hold above 129.63 and close above 130.55 (see charts below.)

SP500:


SPY:


Share It

Friday, July 29, 2011

YOKU

Looks like YOKU could be making a move up toward the 200 SMA near the 40.50 level, and possibly could move to the upper bound of the rising price channel near 44.20 level of the 100 SMA.


Disclosure: no position on YOKU


Share It

Tuesday, July 26, 2011

Ready To Move

Here are three stocks that been beaten up for a while, and now they appear to be ready to move.

GS has been trending down and showing divergence between price & MACD. It has broken out the two months downward price channel and trying to break above 139.


HPQ formed an inverted head & shoulder between mid May to the present. If it breaks out of this price pattern, look for potential move to fill the price gap near 39-40 level.


MU has formed a double bottom and could be making a move higher.


Disclosure: long GS & MU, no position on HPQ


Share It

Sunday, July 3, 2011

The Dow Theory Has Spoken

From my last week post about the possibility of the US economy experiencing a double dip, I have suggested to keep an alert on the Dow Theory and keep a watch on some transportation stocks for clues to determine if recent slowdown of the US economy is a double dip or simply a temporary slowdown.

I put up some charts for some transportation stocks that might provide some signs on the future direction of the US economy. As seen from the updated charts below for these transportation stocks, some of them have already broke above the upper channel (red line).


Furthermore, the chart for the DJ Transportation index also shows it has closed at an all time high on Friday, July, 1, 2011, and the Dow Theory has spoken.


Although the DJ Industrial index did not close at a new high above its April 29, 2011 close, but this non-confirmation signaled by the Dow Theory indicates a new high for the DJ Industrial is yet to come.


The significance of the new closing high from the DJT is it is an indication the recent slowdown in the US economy could turn out to be only temporary; ‘slow patch’. When the DJ Industrial index confirms with the DJ Transportation index, then a strong case can be made that the US economy is on a road to recovery. Until then, I will keep watching for the next Dow Theory signal with a bullish bias for the intermediate term.


Share It