Sunday, October 30, 2011

Continue To Move Higher

The market continues to move higher after a brief consolidation near the resistance level. The Dow Jones Industrials consolidated around the 11600 then surged to the 11897 level. Tested this level for resistance couple time and then it breaks out and moving toward the next potential resistance near 12385.


The SP500 also consolidated near the 1220 level after it has rallied from the failed breakdown of the 1101 August low, and then it breaks toward the level in play, which is the 1260. When it broke above the 1260 level, it didn’t waste any time to move up to the 1296. With the current price action momentum, it is very likely the SP500 will bounce up to the 1345 level once it has moved above the 1296 resistance.


The Nasdaq 100 moved above the 2368 resistance level and heading toward 2438 even with some weak price action from AAPL.


The Russell 2000 moved above 738 and immediately surged to the 773 level. Now the sight is set on 816 as a potential target.


The gold ETF, GLD broke the baseline of a double bottom (or a ‘W’) pattern and looks like it is trying to fill the mid-October gap. The next potential resistance is near the 173 level.


The silver ETF, SLV also showing it is trying to fill a gap made in mid-October. It came 7 cents shy of filling the gap. If it proceed to break above the 50/100/200 SMA, look for possible move up to 38 and filling another gap made in mid-October.


AAPL did what it might do prior to earnings report, it moved to a new high and priced the stock for perfection. Once earnings came out and disappointed expectations, the stock sold off and found support near the 391. Now it is consolidation near the 403-405 level. If the market continues to move higher, eventually a market stock like AAPL will be back in sync with the market price movement. When that happens, look for AAPL to break above the 427 and it might make some analyst’s price prediction near the 450 level to come true.


The overall tone of the market is positive and it is indicating the near term trend is up.


Share It

Sunday, October 16, 2011

Follow UP

The market continues to move higher while most traders are in disbelieve on this rally off the failed breakdown. The pull back has been anemic, forcing lot of market participants to chase this move.

The SP500 pulled back from the 1220 resistance only on its first attempt to regain this level since September. Failing to pull back toward the 50 SMA or near the 1170 level, the bulls gained confidence and pushed it above 1220 and closed at 1224.58 on Friday. Similar price actions for the DJIA (see chart below)

AAPL did a minor pullback from the 403, but not enough to give a good risk & reward setup to initiate new swing long. Gold & silver continue to consolidate and setting up for the next move. They are still too early to go long or short until they have move away from the current sideway chop.

Expecting a volatile week with earnings report coming from AAPL, IBM and GS along with OpEx week.

Here are the updated charts for the DJIA, SP500, Nasdaq 100, Russell 2000, AAPL, GLD & SLV.

DJIA:


SP500:


Nasdaq 100:


Russell 2000:


AAPL:


GLD (Gold ETF):


SLV (Silver ETF):


Share It

Tuesday, October 11, 2011

Bouncing Back

After last Tuesday breakdown and reversal back into the trading range, the market is bouncing back toward the upper level of the trading range once again. Although the market is still in the down trend, the earnings report period that just got started could bring some upside surprises that could take the market back to test previous broken support level such as 1260 for the SP500 and 11600 for the DJIA.

Below are the charts for the market indice along with AAPL, GLD & SLV. Click on the chart to get a larger view.

DJIA:


SP500:


Nasdaq 100:


Russell 2000:


AAPL:


Silver ETF (SLV):


Gold ETF (GLD):


Share It

Monday, October 3, 2011

Resolved!

What a difference a day makes. The SP500 finally resolved itself toward the downside by breaking its August low. Now it is a matter of how low will it go before it can find support. From the daily, there could be a minor support near 1060 then the major support level to be tested is 2009’s August low near 1040. This is only 40-60 points away from today’s close. With current volatility, it can reach that level in one to two trading sessions.


When the last chip standing such as AAPL begins to roll over, that could be an indication the market is entering a capitulation phase. From AAPL price chart, if it breaks below 360 and the March 2009 trend line, capitulation could be near if not already occurring. Will be watching to see what kind of a bounce AAPL will receive after its iPhone 5 announcement tomorrow, this could be a clue on what’s to come.


Share It

Sunday, October 2, 2011

Still Waiting For Resolution

Continue to wait for the SP500 to resolve from its multi-months trading range. Looking at last week’s result, it seems like the index didn’t change much since it ended the week near where it started. But if one takes a deeper look at individual stocks, one can see there has been some damage done that could be the start of the resolution toward lower low that everyone is waiting for.

Here are the updated charts for the SP500, SPY and the QQQ:

SP500 (weekly):


SP500 (30 minutes intraday):


SPY (weekly):


QQQ (weekly):


Share It

Sunday, September 25, 2011

A Precursor

Last week, the SP500 went from the top of the trading range to the bottom of the trading range, a move of more than 100 points. At the same time, the gold and silver market also took a dive. Gold drop more than $175 and silver loss more than $10. These moves could be a precursor to an extended downward move.

In the coming week, the key thing to watch is will the SP500 bounce back to the top of the trading range near the 1220 or will it break below the lower range and dip below the 8/9/2011 low of 1101.54. If the SP500 fails to hold above 1101, then a new downward move will take this index to the 1040 level.

SP500:


SP500 (30 minutes intraday):


Gold could also get a bounce. Looking at the gold ETF, GLD could get a bounce between the 50 & 100 SMA. The key level to monitor is the 100 SMA. If it breaks below the 100 SMA, look for next likely support near 151.50.

GLD:


Silver ETF, SLV next likely support level is near 27.25. It broke below the previous support level near 32.50 and made a feeble attempt to try to get back above it without any success.

SLV:


All three markets had a down week and a dead cat bounce from these markets next week will not be surprising. But the trend remains to be down, and the current environment is most suitable for the day/short term traders.

Disclosure: No position in GLD, SLV.


Share It

Tuesday, September 20, 2011

SP500 - 1220 Level

Here is the updated SP500 30 minutes intraday chart. The SP500 bump against the 1220 resistance today and reversed. Key level for the bulls to defend tomorrow is the 5 days EMA near 1200.

SP500 (30 minutes):


Share It

Sunday, September 18, 2011

SP500 Update

The 30 minutes intraday chart of the SP500 depicts how it has been trading within the 1120-1220 range since the beginning of August. It formed a double bottom pattern in August and it was unable to break out of this pattern. After the failed breakout, the bears pushed it back down to the 1140 level when the bulls attempt to take it back above the 1120 1220 level. In the last trading session, the bulls finally were able to push above the 1120 1220 level once again. If the bulls can hold the SP500 above the 1120 1220 and move it beyond the 1130 1230 level, the head & shoulder baseline of 1260 could be the near term upside target once again.

Here are the levels to monitor for the coming week:

Upside: 1220, 1230 then 1260/1270
Downside: 1180 then 1140


SP500:


note: corrected reference levels typo (9/20/11)


Share It

Saturday, September 17, 2011

A Change In The Market

The SP500 has been chopping around within a range of 1120-1220 and it appears went nowhere. But if one look at various sectors within the market, one could sense the market’s characteristic is changing, at least for the near term. This change does not imply the market is reversing direction and heading toward a new bull trend. But the price actions of the sector ETFs shown on the following chart are signaling a possible near term rally could be in the offing. Unless something unexpected happen in the Euro zone, the market appears to have adjusted to whatever will most likely to occur.

(Click on the chart to get a larger view. The red lines are likely resistance & support levels)


Share It

Sunday, September 4, 2011

New High Coming For Gold & Silver?

Gold and silver held their ground after gapped up during the last trading session. There could be some retracement before they make an attempt to a new high.

GLD (Gold ETF):


GLD (30 minutes intraday):


SLV (Silver ETF):


Disclosure: Long on SLV


Share It

Wednesday, August 31, 2011

Moving Toward The Neckline

While market participants are waiting for the SP500 to come back down and test the 8/9/11 low of 1101.54, the index is making a turn toward the H&S neckline it has broken near the 1260 level.

Here are the updated price charts for the SP500 and its ETF, SPY.

SP500:


SP500 (30 minutes):


SPY:


SPY (30 minutes):


The 30 minutes intraday charts show there is a double bottom price pattern formed from recent price actions, and the measure move could push the SP500 and the SPY above the H&S neckline. If that happen, it is another reminder from the market to remind us don’t expect the expected (right now, lot of talking heads are staring at the 1260 level as the next possible resistance level.)


Share It

Sunday, August 28, 2011

Gold & Silver (GLD, SLV)

After the price of gold made a new high last Monday, it sold off and its ETF, GLD, dropped from a price near 185 to just below 166 in less than 3 trading sessions. Looking at the 30 minutes price chart for GLD, it shows the price moved below the 167.50 support level briefly. In the last trading session, GLD moved back above the previous R&S level near 175 and held above its 5 day SMA. If GLD continue to move up and break above the 181.60, it has the potential to make a newer high. But if it hit resistance between 175 and 182, lookout for a possible H&S pattern that could lead to lower prices.

GLD:


SLV:

Silver retraced along with the sell off on gold. The price of its ETF, SLV pulled back and filled the recent up gap and held above the 50 SMA. The daily price chart showing it could be getting ready for another move toward the 43.55 resistance level and possibly toward making a new high. The key support to watch for SLV will be its 50 SMA and the resistance level to watch is 43.55.


Unless GLD forms a head & shoulder pattern in its 30 minutes chart and SLV breaks below 50 SMA, the short term trend bias for these two shining metals is up.


Share It

Tuesday, August 23, 2011

Silver Pull Back

After 7 consecutive days of rising prices, profit taking finally hit this shining metal, silver. For those traders that went long when silver was hovering around the 20 EMA near the mid 38 level, taking some profit here seem to be a prudent thing to do.

This pull back in silver prices does not appears to be a trend reversal. The price actions still pointing toward potential higher prices until a technical breakdown has occurred to indicate otherwise. The level to watch for possible support for the silver future SI_F is near 40.40 and for the ETF, SLV is 39.30 (near their respective 20 EMA).

SI (silver future contract):


SLV (silver ETF):


Disclosure: No position.


Share It

Sunday, August 21, 2011

Silver On The Move

Silver is on the move once again after spending couple months building a base near the $33 area.

SI (Silver Future Contract):


Looking at its ETF price chart, it has formed a base near the 32.50 level. After having completed its test for support near the 36 level, it has broke above the previous pivot high of 41.73. This breakout appears to be forming a higher high/higher low price pattern that could lead to a new high.

SLV (Silver ETF):


Disclosure: Long on SLV


Share It

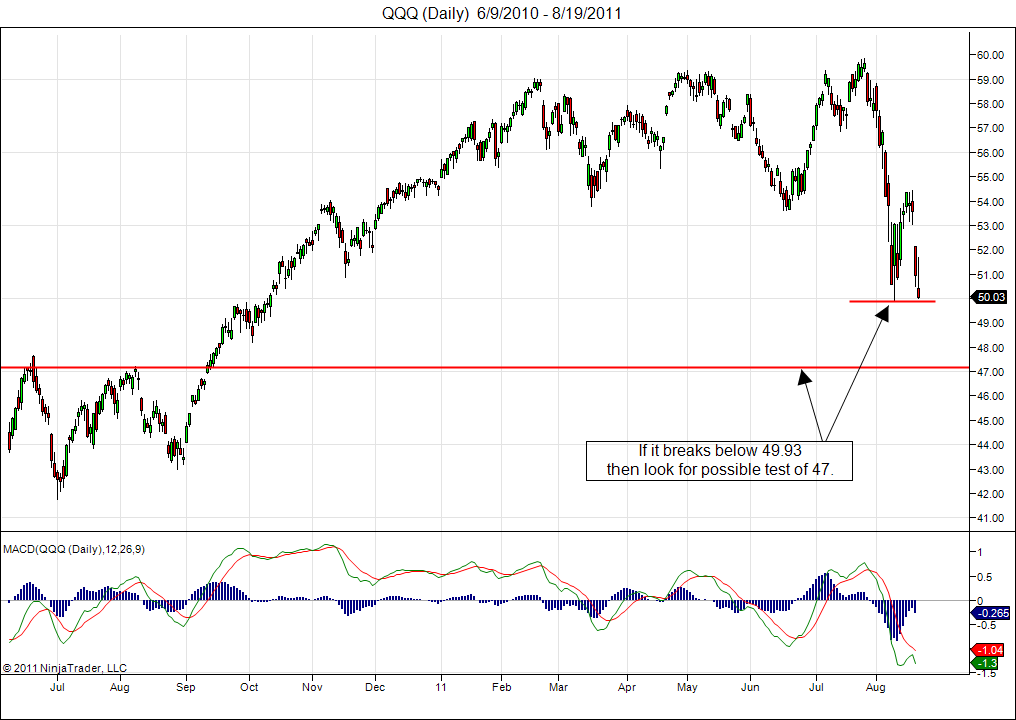
Attempt To Find Support

Last week, the major market indices bounced a bit then they resumed to their downward trend. As the OpEx week came to a close, these market indices sitting near their August low.

When the new trading week begins, look for the market to make an attempt on finding support near the August low. If it fails to hold above this low, then the likelihood for the market to dip into the support/resistance levels made in August 2010 is high.

This is a tricky period to initiate new shorts and definitely dangerous to go long. I will remain very cautious until the market either breaks below the August low or it has formed a short term reversal of higher low/higher high pattern.

Here are the updated charts highlighting some critical levels to monitor.

DJIA:


SP500:


SPY:


Nasdaq 100:


QQQ:


Share It