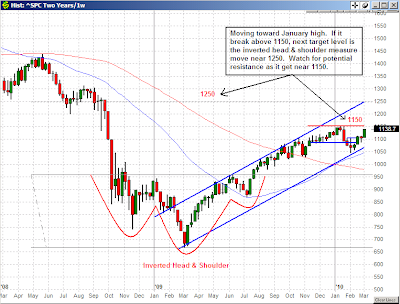
The market finished the week strongly with a convincing move above its resistance level. The SP500 moved above its resistance level of 1115 and it is heading toward the January high near the 1150. Similarly for the DJIA, NASDAQ 100, and the Russell 2000, they have also moved above their resistance level. The Russell 2000 has broken above its January high. But look at what is back in play, the measure move from the inverted head & shoulder pattern that was formed between October 2008 and August 2009 for the SP500, DJIA, and the Russell 2000.
Here are the updated weekly charts with the inverted head & shoulder pattern highlighted and the measure move target from the inverted head & shoulder pattern.
SP500:
 DJIA
DJIA:
 Nasdaq 100
:
 Russell 200
:

Although the market has signaled it wants to go higher, but there are lot of stocks near intermediate resistance level. I will be watching how these resistance levels are handled because they can easily cause a short term reversal especially after a recent strong run-up.


