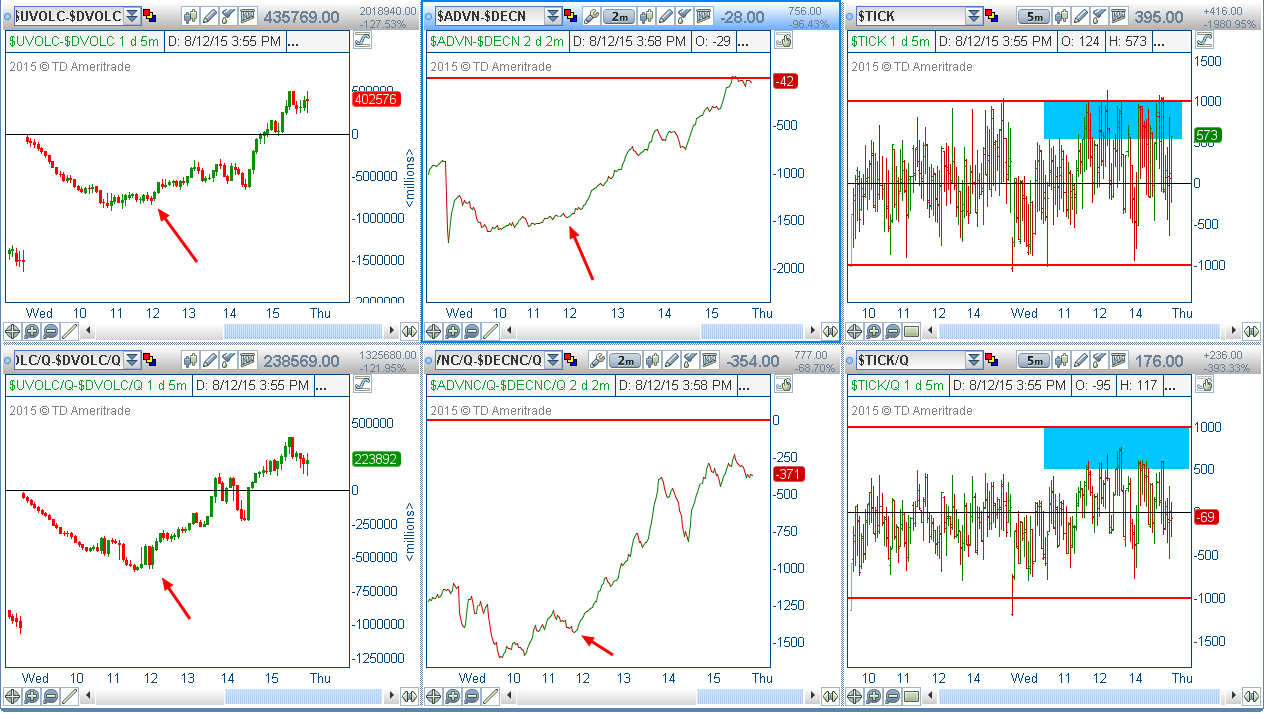
Market Breadth Chart
(click chart to enlarge)
Once again, the SP500 closed above the 2079.11 support at 2086.05 with a gain of 1.98 or 0.10%. The potential support levels for this index remain to be 2079.11, 2063.52 and 2039.69. The potential near term resistance level continues to be 2108.86.
SPX

For the SPY, it also closed above the 207.95 support at 208.92, a gain of 0.25 or 0.12%. The potential resistance levels remain to be 211.63 and 211.99, and the potential support levels are 207.95, 206.26, 205.27 and 204.40.
SPY

The Nasdaq 100 intraday low came within less than 3 points from filling the 7/13/2015 price gap at 4434.11. It closed above the 4506.19 support level at 4528.19, a gain of 14.20 or 0.31%. The potential major resistance remains to be the 7/22/15 price gap at 4643.83. The potential support levels are 4506.19, 4434.11 and the support zone between 4379.75 and 4349.93.
NDX

The Russell 2000 broke below the 1200.74 support shortly after the open. It then proceeded toward the Fibonacci 127% extension before it found buyers to lift it back up. At the close, it ended at 1208.98 with a small loss of -2.16 or -0.18%. It did close above the ‘H’ pattern baseline. The potential near term resistance levels are 1215.42 and 1238.76. The potential support remains to be the 2/2/15 price gap between 1180.06 and 1175.51.
RUT

The market made an impressive reversal today, but one must remain defensive as oversold rally can be short lived. Although the market breadth improved during the session, but by no means the overall breadth has regained strength to sustain a trend reversal. Until the overall market breadth has improved, one should continue to exercise caution.