Before I proceed to talk about the message from the market, let me just say this, “This time is no different than any time in the past.” The FED always has its hands in the market to create the bubble and to pop the bubble it has created. If you believe this time is different because of the QE the FED had implemented, you are dead wrong! This is no different than the time when Greenspan pump liquidity into the system to create the tech bubble back in 2000, and no different than when Milken the junk bond king blew up the entire Savings & Loans industry. One thing is certain in the market; history repeats itself.
At the present, the SPX has lost -2.6% for the year. On the first trading day of the year it lost -31.28 points or -1.53%, and the second day it gained back 4.05 points or +0.2%, then today it lost -26.45 or -1.31%. Just from these 3 days, one can conclude the trend for the first three days has been down, without counter the last two trading days from 2015. What might not be obvious is what the market internals have been doing.
Going back to December 18, 2015, the SPX closed with a lower low accompanied with positive breadth divergence. Today, the SPX close below the December 18, 2015 also accompanied with positive breadth divergence. Studying the recent price action using the daily chart of the SPX, one will see the September 17, 2015 (FOMC announcement) intraday high of 2020.86 has been revisited multiple times. Every time it closed below this level in 2015, it quickly snapped back above this level and made a lower high. These lower high created a short term downtrend. Another level that has been revisited multiple times is the pivot close on September 16, 2015, (the day prior to the FOMC announcement day) at 1995.31. Each time the price dipped to this level, it bounces back and moved up to or above the 2020.86.
SPX:
(click on the chart to enlarge)
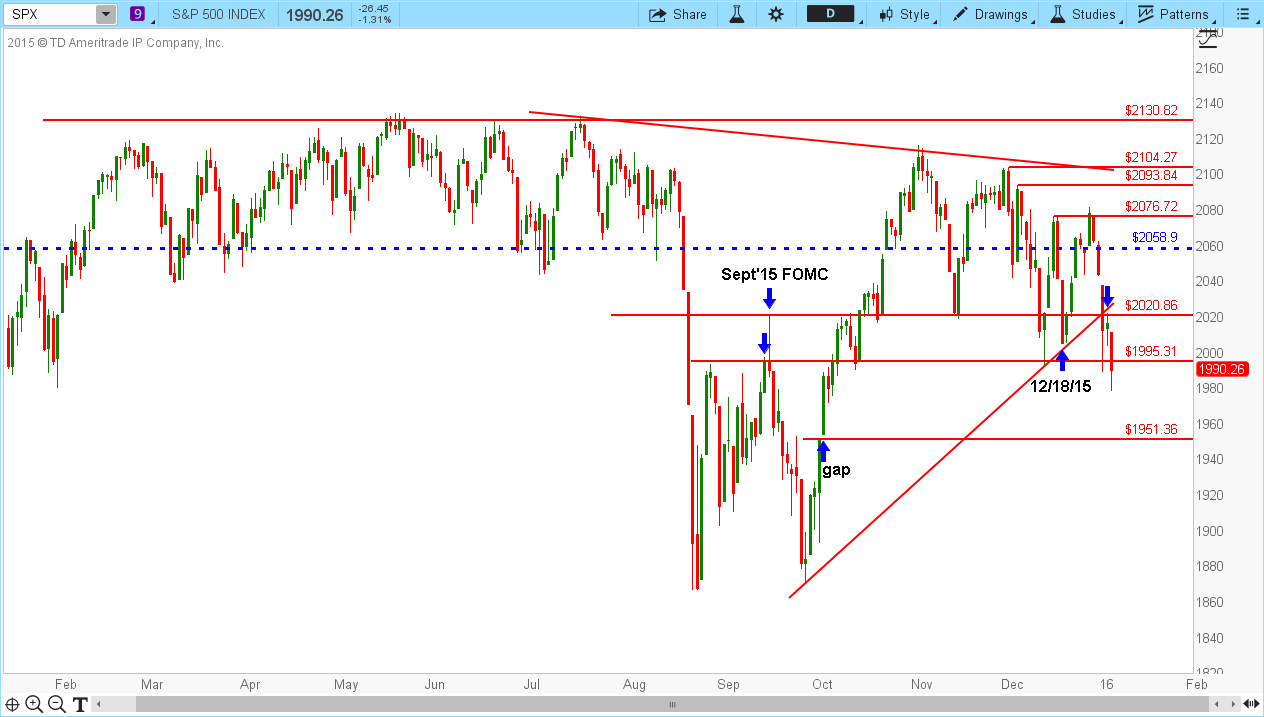
Fast forward to January 4, 2016, the first trading day of the new year, it opened below the 2020.86, dipped below 1995.31 after the first hour of trading and closed at 2012.66. Then on the following day, it got back above the 2020.86 level during intraday, it reached as high as 2021.94 then closed below at 2016.71. Today, it failed both level. It failed by getting back above the 2020.86 level and failed to hold above the 1995.31. Today’s low was 1979.05 and closed at 1990.26, little more than 5 points below the September 16, 2015 pivot high. In the past, whenever there is a positive divergence with a lower close, a rally ensued. The last time it did that was on December 18, 2015. Does it mean a rally is in the offing for the near future? No one know. There is a saying in this business, whatever happened in the past is not a guarantee it will happen in the future. Therefore, your guess is as good as mine.
Let look at this week’s open interest for the weekly SPY options due to expire in two days and see if the gap will get filled during regular trading hours.
From the Open Interest (OI) chart, the strikes with high OI for the PUT are at 191, 197, 198, and 205. The SPY closed at 198.82, and those 205 PUTs are deep in the money and it will take a huge rally to make them worthless, vice versus for the 191 PUTs, it will take a tremendous selloff to get this strike in-the-money. Therefore, the probability for these two strikes to get hit is low. The 198 and the 197 PUT are slightly out-of-the-money, and if the SPY drops to fill the 195 gap, then the 198 and 197 strike will be in-the-money.

Here’s one possible scenario: the SPX dropped below 1951.36 to fill the gap and that in return will put the 197 PUT in-the-money for some of the holders along with the 198 PUT holders to cash out. This unwinding process will cause the MM to cover their hedged short and in turn will cause a short cover rally. The momentum from this unwinding could cause the SPX to rally back to 1995, and that could cause a short squeeze that can take it back up to 2020.86 to get near the 203 pin. I know, lots of up and down. But if you have watch the machine works its magic on OpEx, anything is possible. Another possible scenario is the positive breadth divergence could disappear as the market continues to make lower low with deteriorating breadth. In this scenario, the August 2015 low could be back in play!
Here's a caveat, the SP500 ES futures is down -32 points in the overnight market as I am writing this. China’s market is hauled for trading for the rest of the day again due to dropping more than 7%. Will the US market continues to fall when it open tomorrow or will the futures be rally back up when the Europe markets open. For the SPX, there is a small gap near 1951.36 that hasn’t been filled. This is the 195 gap on the SPY. So far, the low for the SP500 ES futures is 1952.50. Maybe the rally will show up after this gap has been filled from overnight or from pre-market.
In regardless what might happen in the next few days, 2016 most likely will not be a repeat of 2015. It will more likely revert to a trending market, but the bad thing is the signs are indicating the trend will likely be down.
As always, trade defensively and manage your risk. Cash is a position!